


November 2, 2026 – Business development companies (BDCs) and mergers and acquisitions (M&A) operate in seemingly different corners of the capital markets, however, are more closely connected than they initially appear.
Primarily, BDCs provide debt financing to middle-market companies, generating returns through interest income, while M&A involves the buying and selling of businesses, with returns driven by changes in corporate ownership and valuations. Both are fundamentally tied to the state of the economy, the availability of capital, and the business cycle.
Their paths often connect, mainly though the financing of leveraged buyouts. BDCs provide the debt capital to fund middle market M&A, supporting private equity companies as they consolidate industries. Generally, M&A is a catalyst for underlying BDC loan activity, creating investment opportunities and portfolio turnover (in addition to transaction fees). As a result, the underlying drivers of BDC and M&A activity and economics are often shared.
Nonetheless, these two market segments sometimes interact in unorthodox ways. While the default relationship is BDCs financing M&A transactions, occasionally, BDCs experience M&A activity within themselves.
For example, last week, Ares Capital Corporation (NASDAQ: ARCC), the largest publicly traded BDC, announced the acquisition of a subscale competitor, Apollo’s MidCap Financial Investment Corporation BDC (NASDAQ: MFIC) for $2.6 billion. While the cash-and-stock deal came at a 30.1% share price premium for MFIC holders, ARCC was opportunistic in acquiring the MFIC loan portfolio at 0.85x its net asset value (NAV). This 15% NAV discount was not lost, however, it will accrue to ARCC holders over time (note that ARCC is currently trading near its net asset value). Beyond the resulting NAV accretion, the acquisition is highly synergistic for ARCC, as it brings MidCap’s loan portfolio to a platform more than 10x the size. Nevertheless, this BDC M&A deal highlights the gap between publicly traded BDC prices and their underlying fundamental asset values.
This highly strategic and logical BDC merger was not the first instance of M&A in the asset class. Ares has a successful track record of BDC mergers and acquisitions. In 2009, ARCC acquired the distressed Allied Capital BDC at a 27.1% share price premium (and a 48.2% NAV discount). In 2016, ARCC acquired the struggling American Capital, acquiring the BDC at an 11.4% share price premium and a 13.6% discount to NAV. According to ARCC, both of these BDC acquisitions generated rates of return in excess of 20%. ARCC’s strategy of extracting value from subscale BDCs through the resolution of balance sheet issues and the lowering of expenses will likely be the same playbook used for its acquisition of MFIC.
Traditional M&A is not the only corporate action in which BDCs and M&A collide. Occasionally, BDCs are involved in special purpose acquisition companies (SPACs).
In October, Cion Investment Corp (NYSE: CION), a small-cap BDC, announced an unconventional M&A transaction. Cion, along with SPAC K&F Growth Acquisition II (NASDAQ: KFII), announced a letter of intent to merge a Cion investment, AI-powered wedding marketplace Pearl, with KFII to create a new, $350 million public company. Pearl is a subsidiary of David’s Bridal, which Cion owns after a loan restructuring. While the proposed transaction faces a myriad of risks and may not close as proposed, it certainly is a unique and perhaps unprecedented scenario in which the world of BDCs and M&A collide through a special purpose acquisition company.
Overall, the M&A environment remained relatively robust in October, with 23 mergers announced in North America worth an aggregate of $200 billion. This figure includes six Canadian M&A transactions worth more than $60 billion – a significant tally that has not been seen in some time.
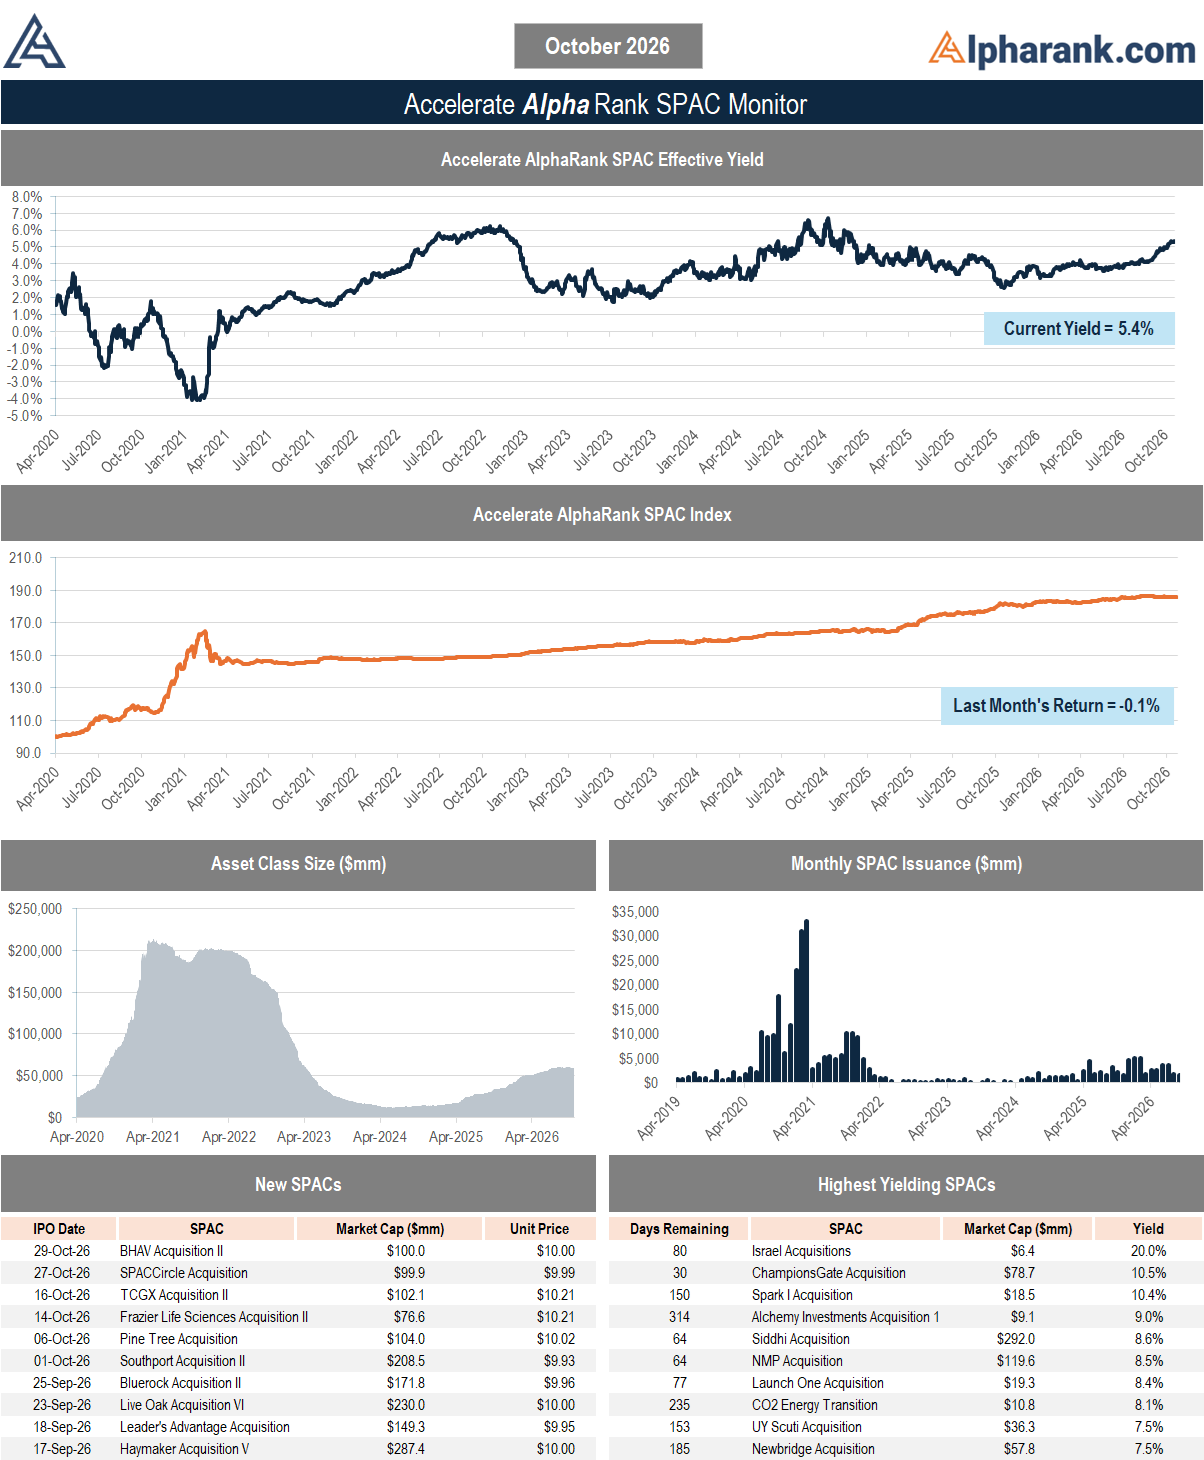
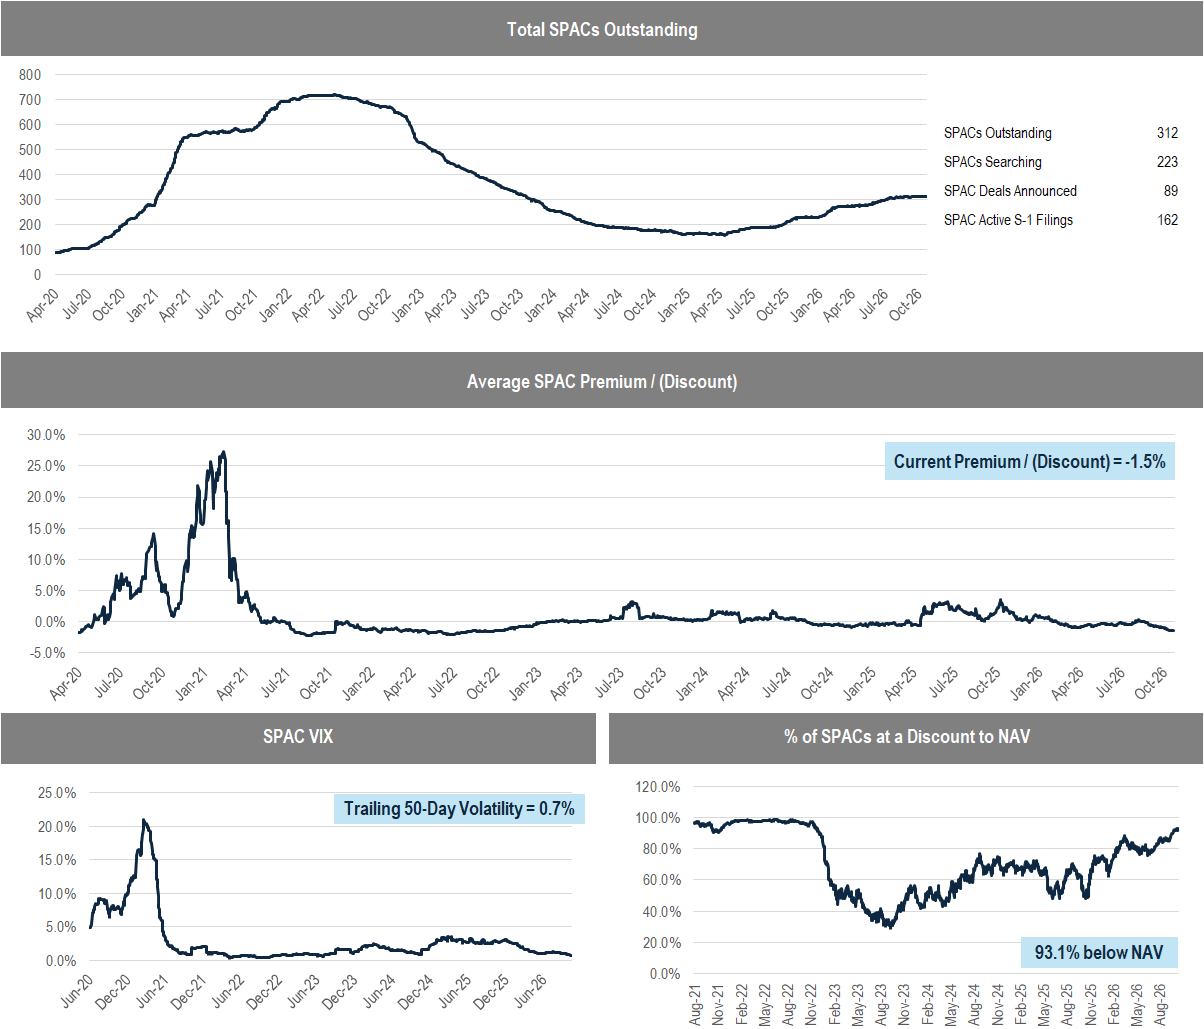
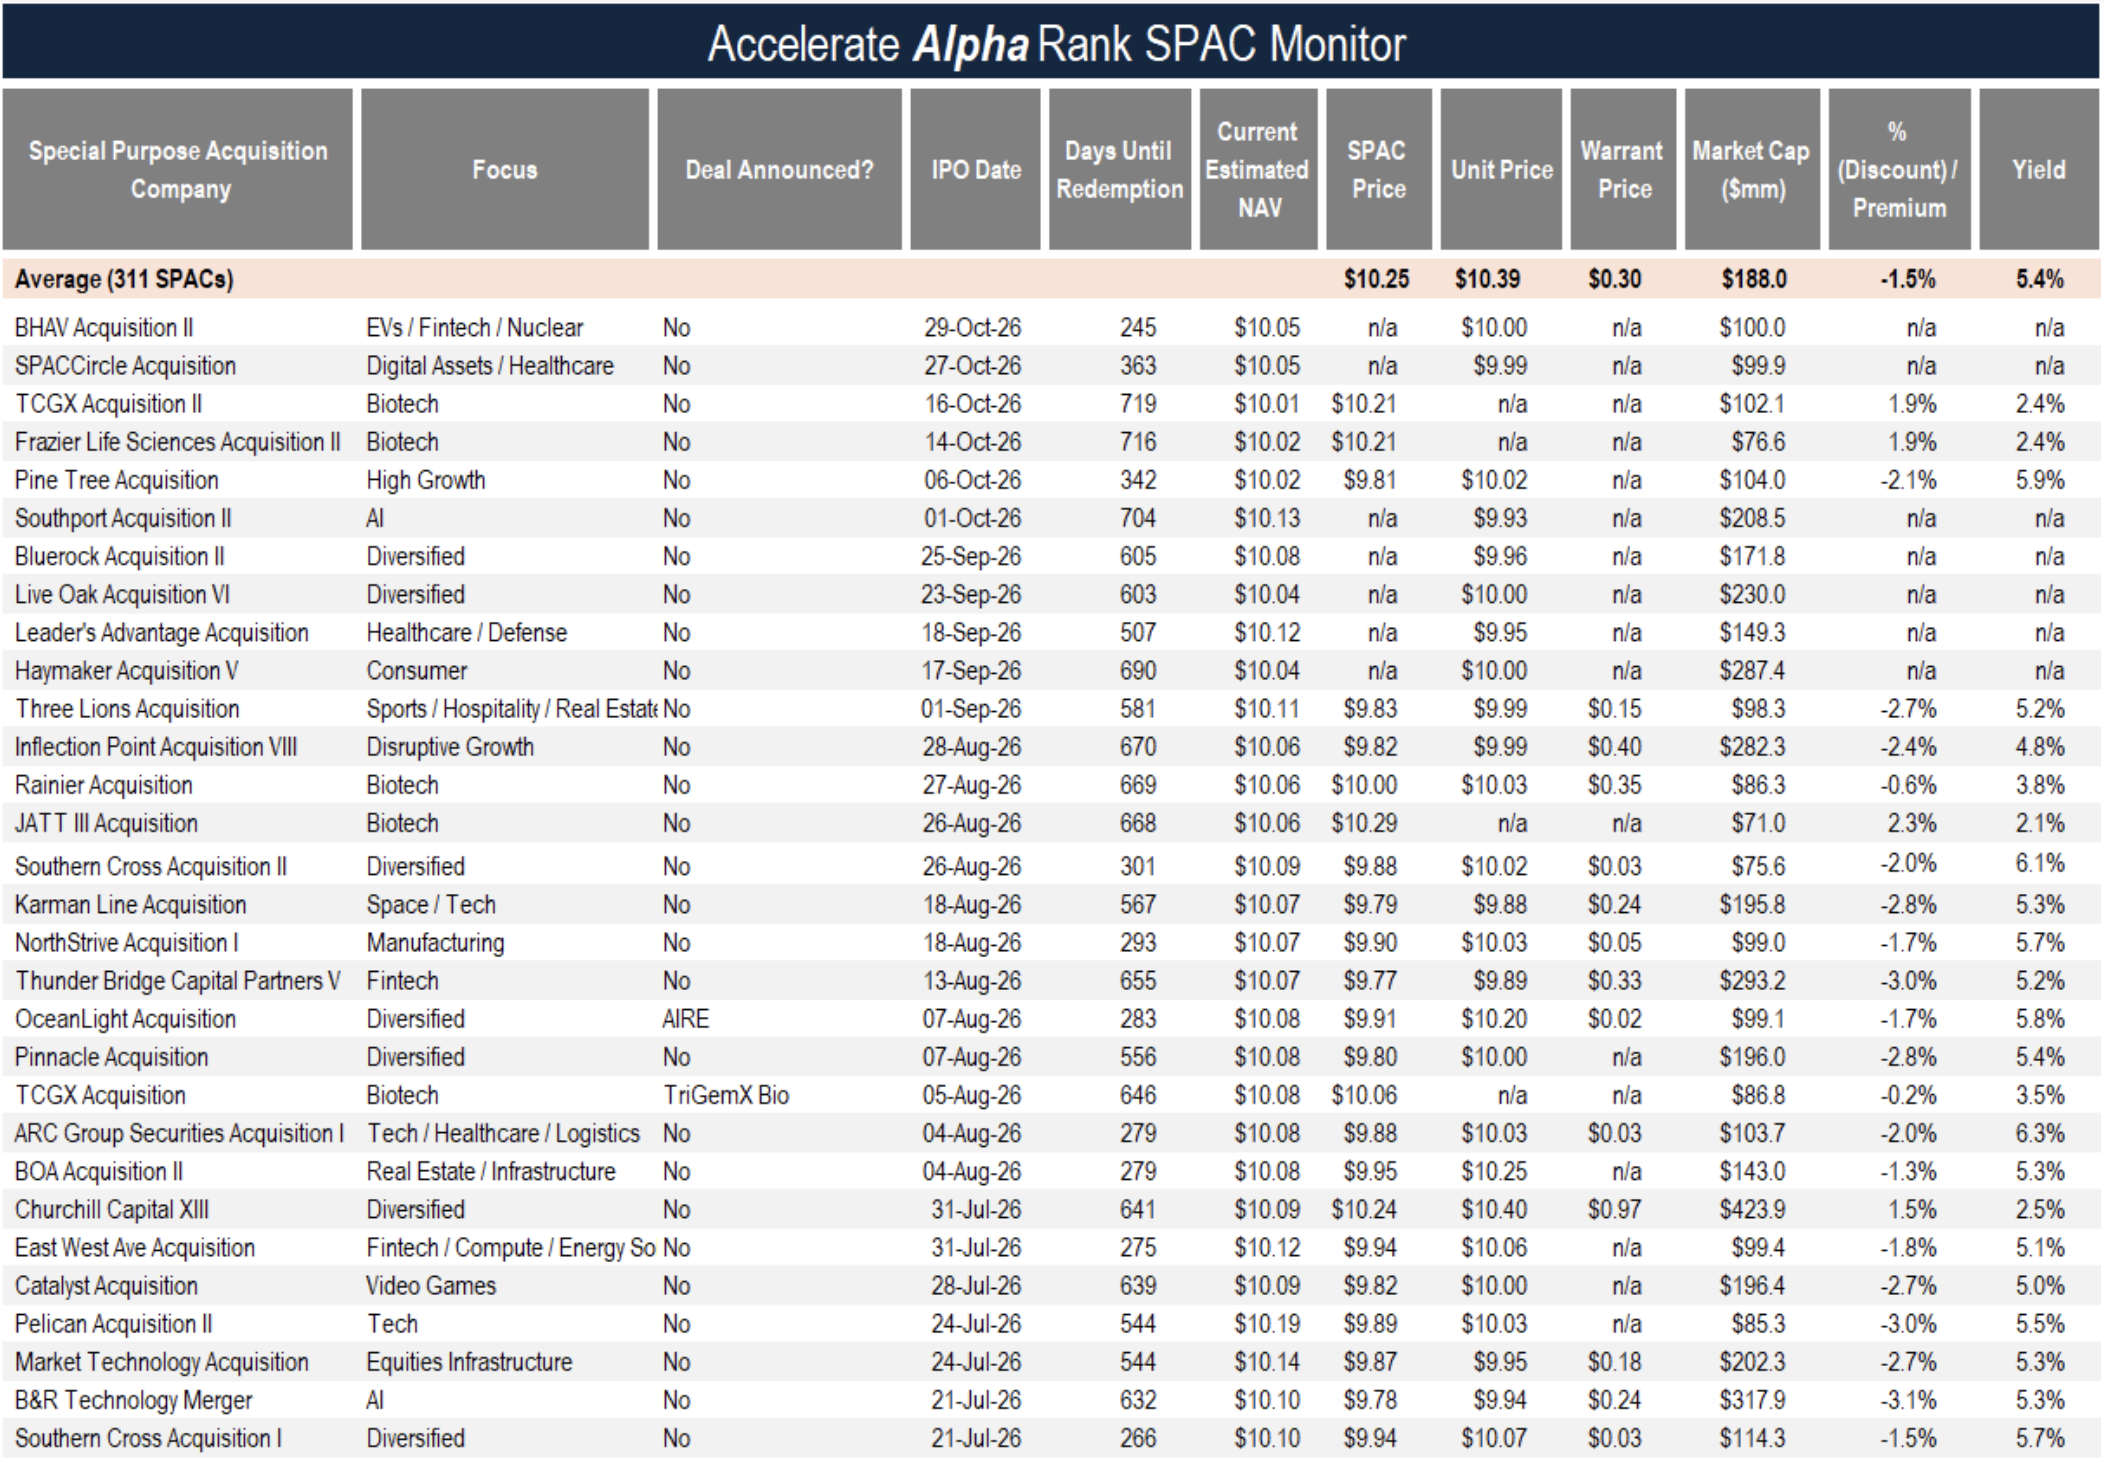
Meanwhile, the SPAC market has slowed markedly. In October, just six SPAC initial public offerings came to market, raising a paltry $675 million (compared to the $2.9 billion per month over the past year). Moreover, ten SPAC mergers were announced last month, worth a total of $6.7 billion. The market’s reaction to SPAC mergers remains dreadful, as SPAC market sentiment plumbs lows not seen in years. This dynamic is reflected in widespread NAV discounts in the SPAC market, with the average blank check company trading at a 1.5% NAV discount, its lowest level since 2022. That said, it’s tough to see the SPAC market heading any lower, given the average SPAC arbitrage yield of 5.4%, which is a significant premium to T-bills and a highly competitive yield compared to the bond market. As they say, “the thing about hitting rock bottom is that there is only one direction left to go: up.”
The AlphaRank.com Merger Monitor below represents Accelerate’s proprietary analytics database on all announced liquid U.S. mergers. The AlphaRank Merger Arbitrage Effective Yield represents the average annualized returns of all outstanding merger arbitrage spreads and is typically viewed as an alternative to fixed income yield.
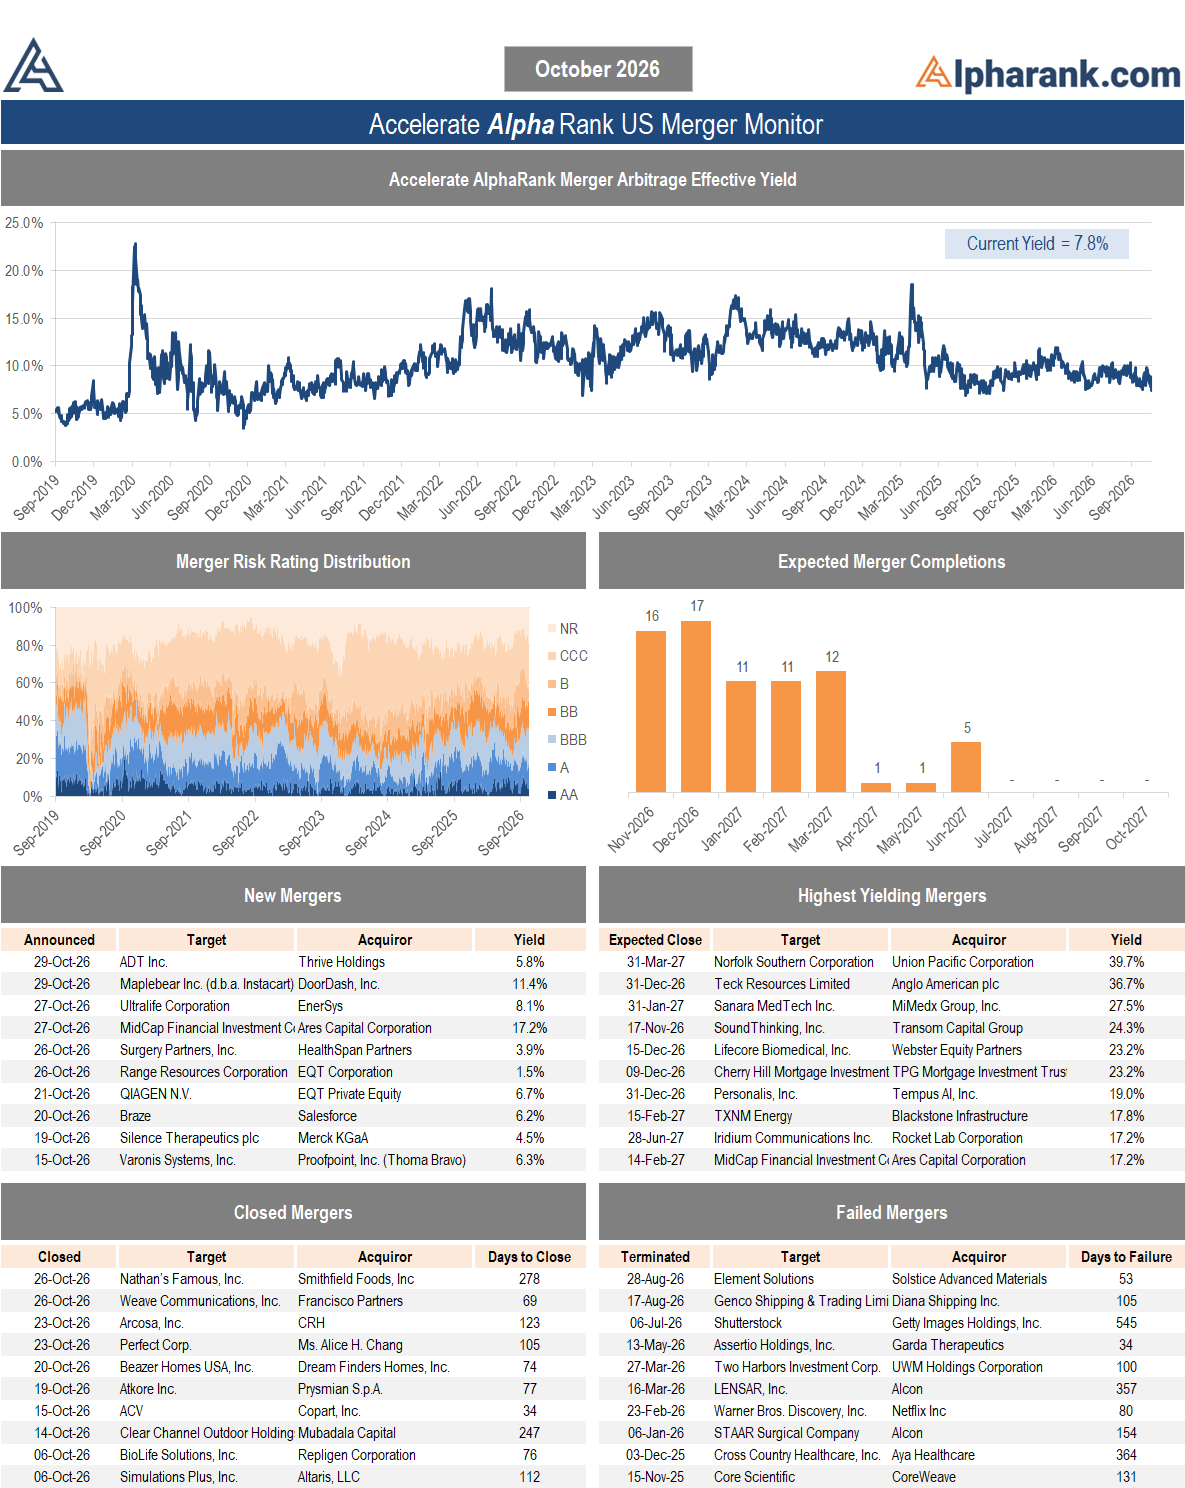
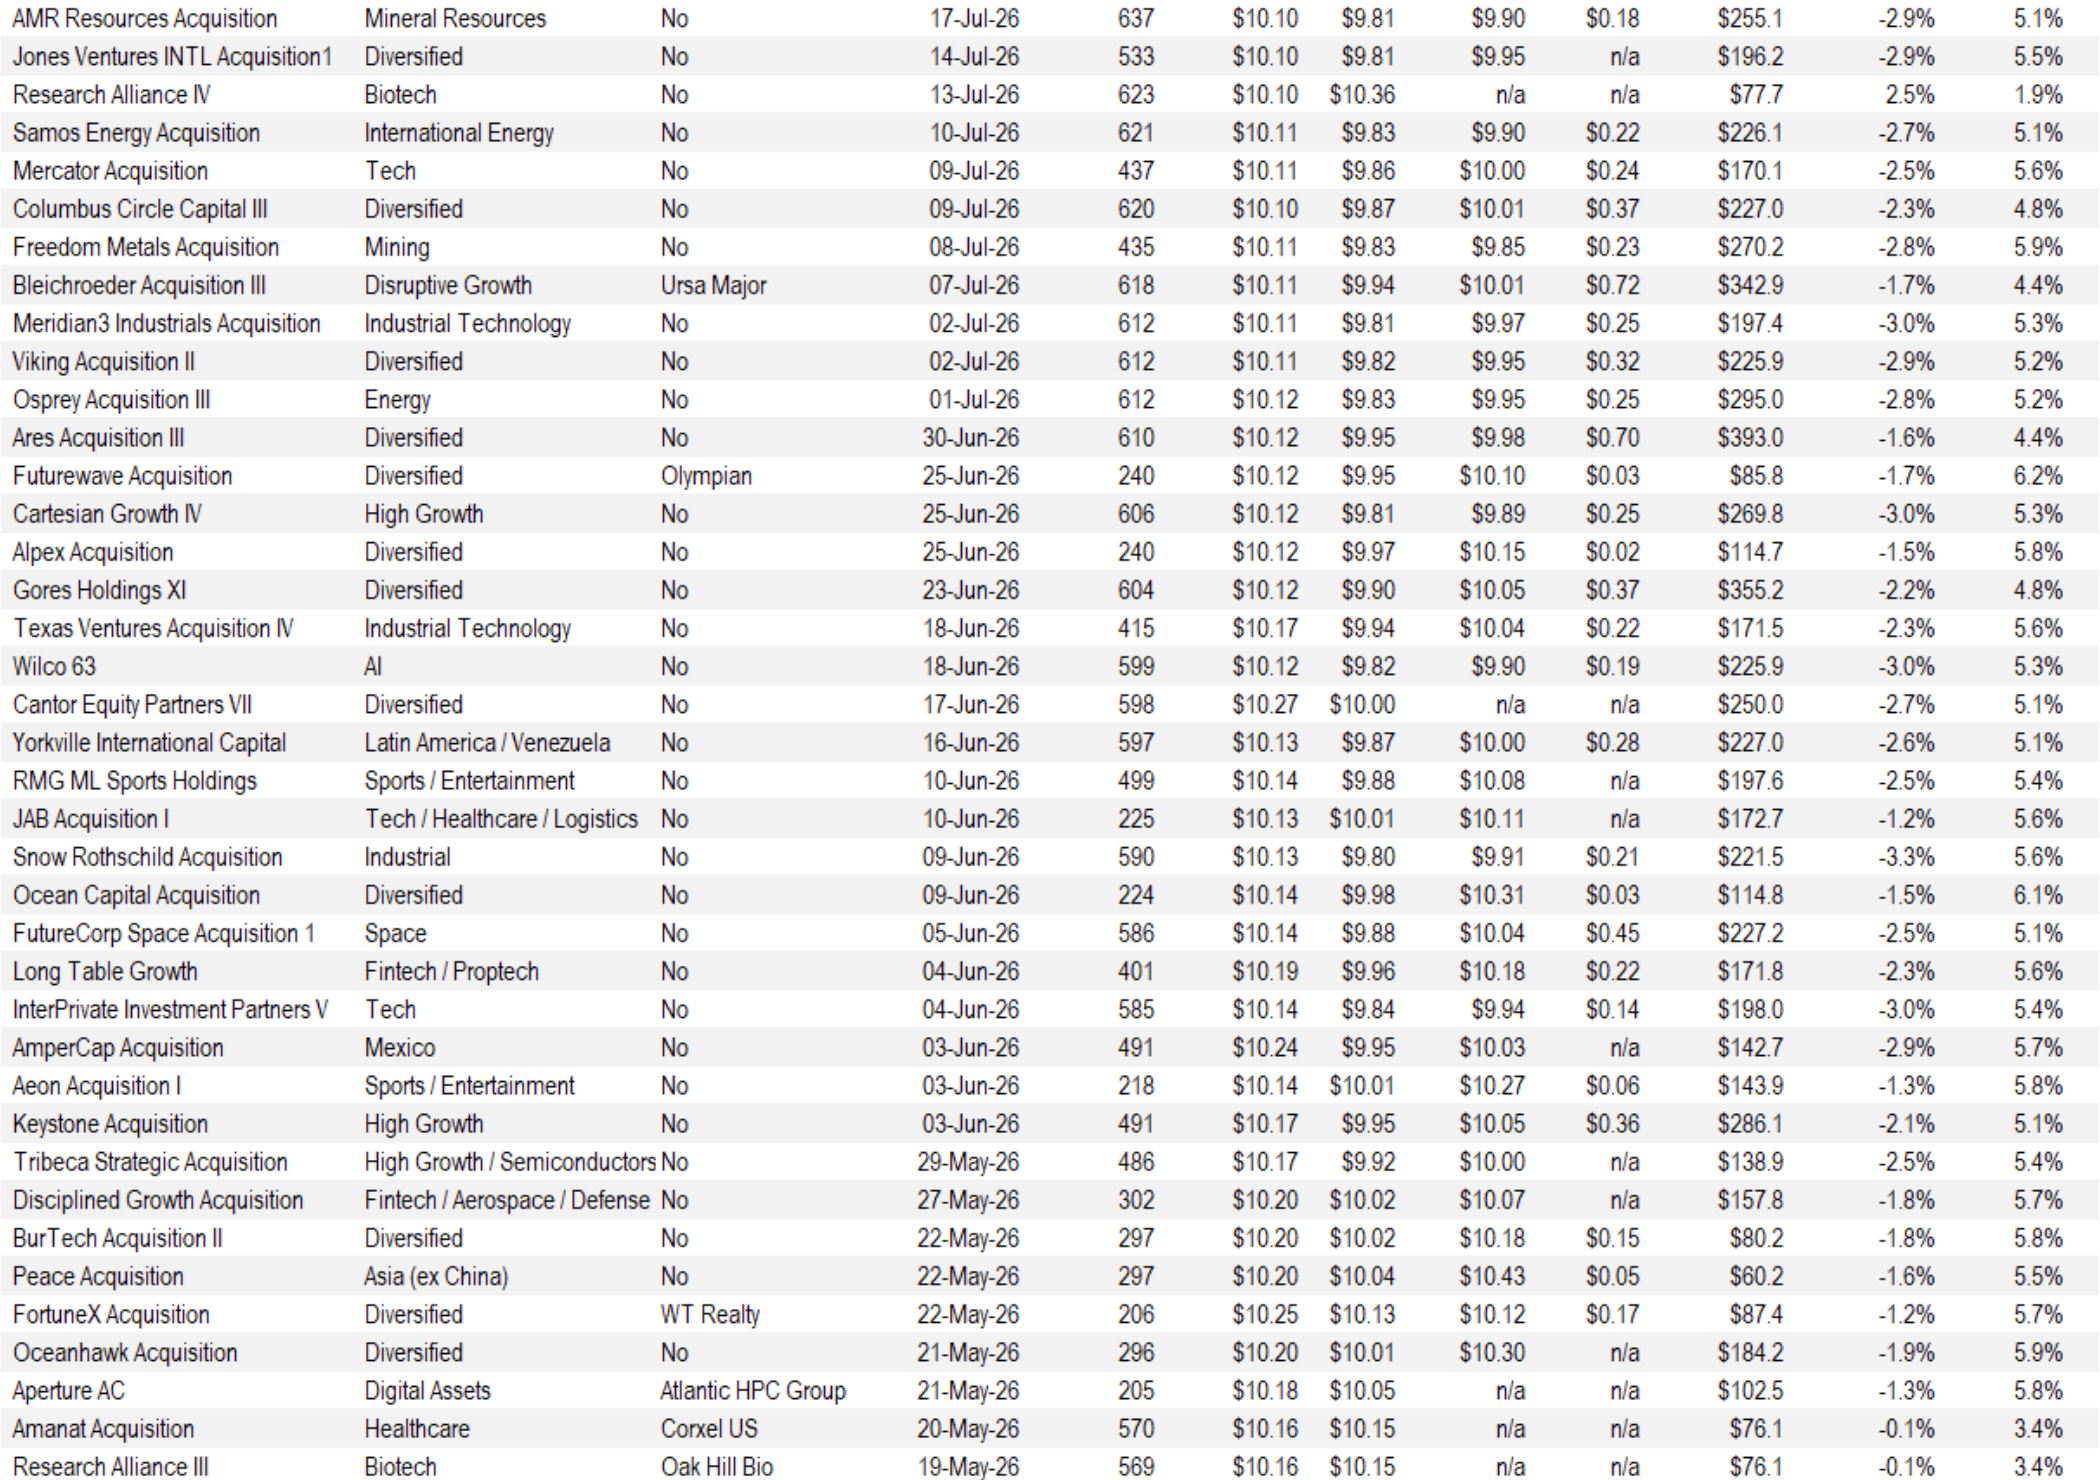
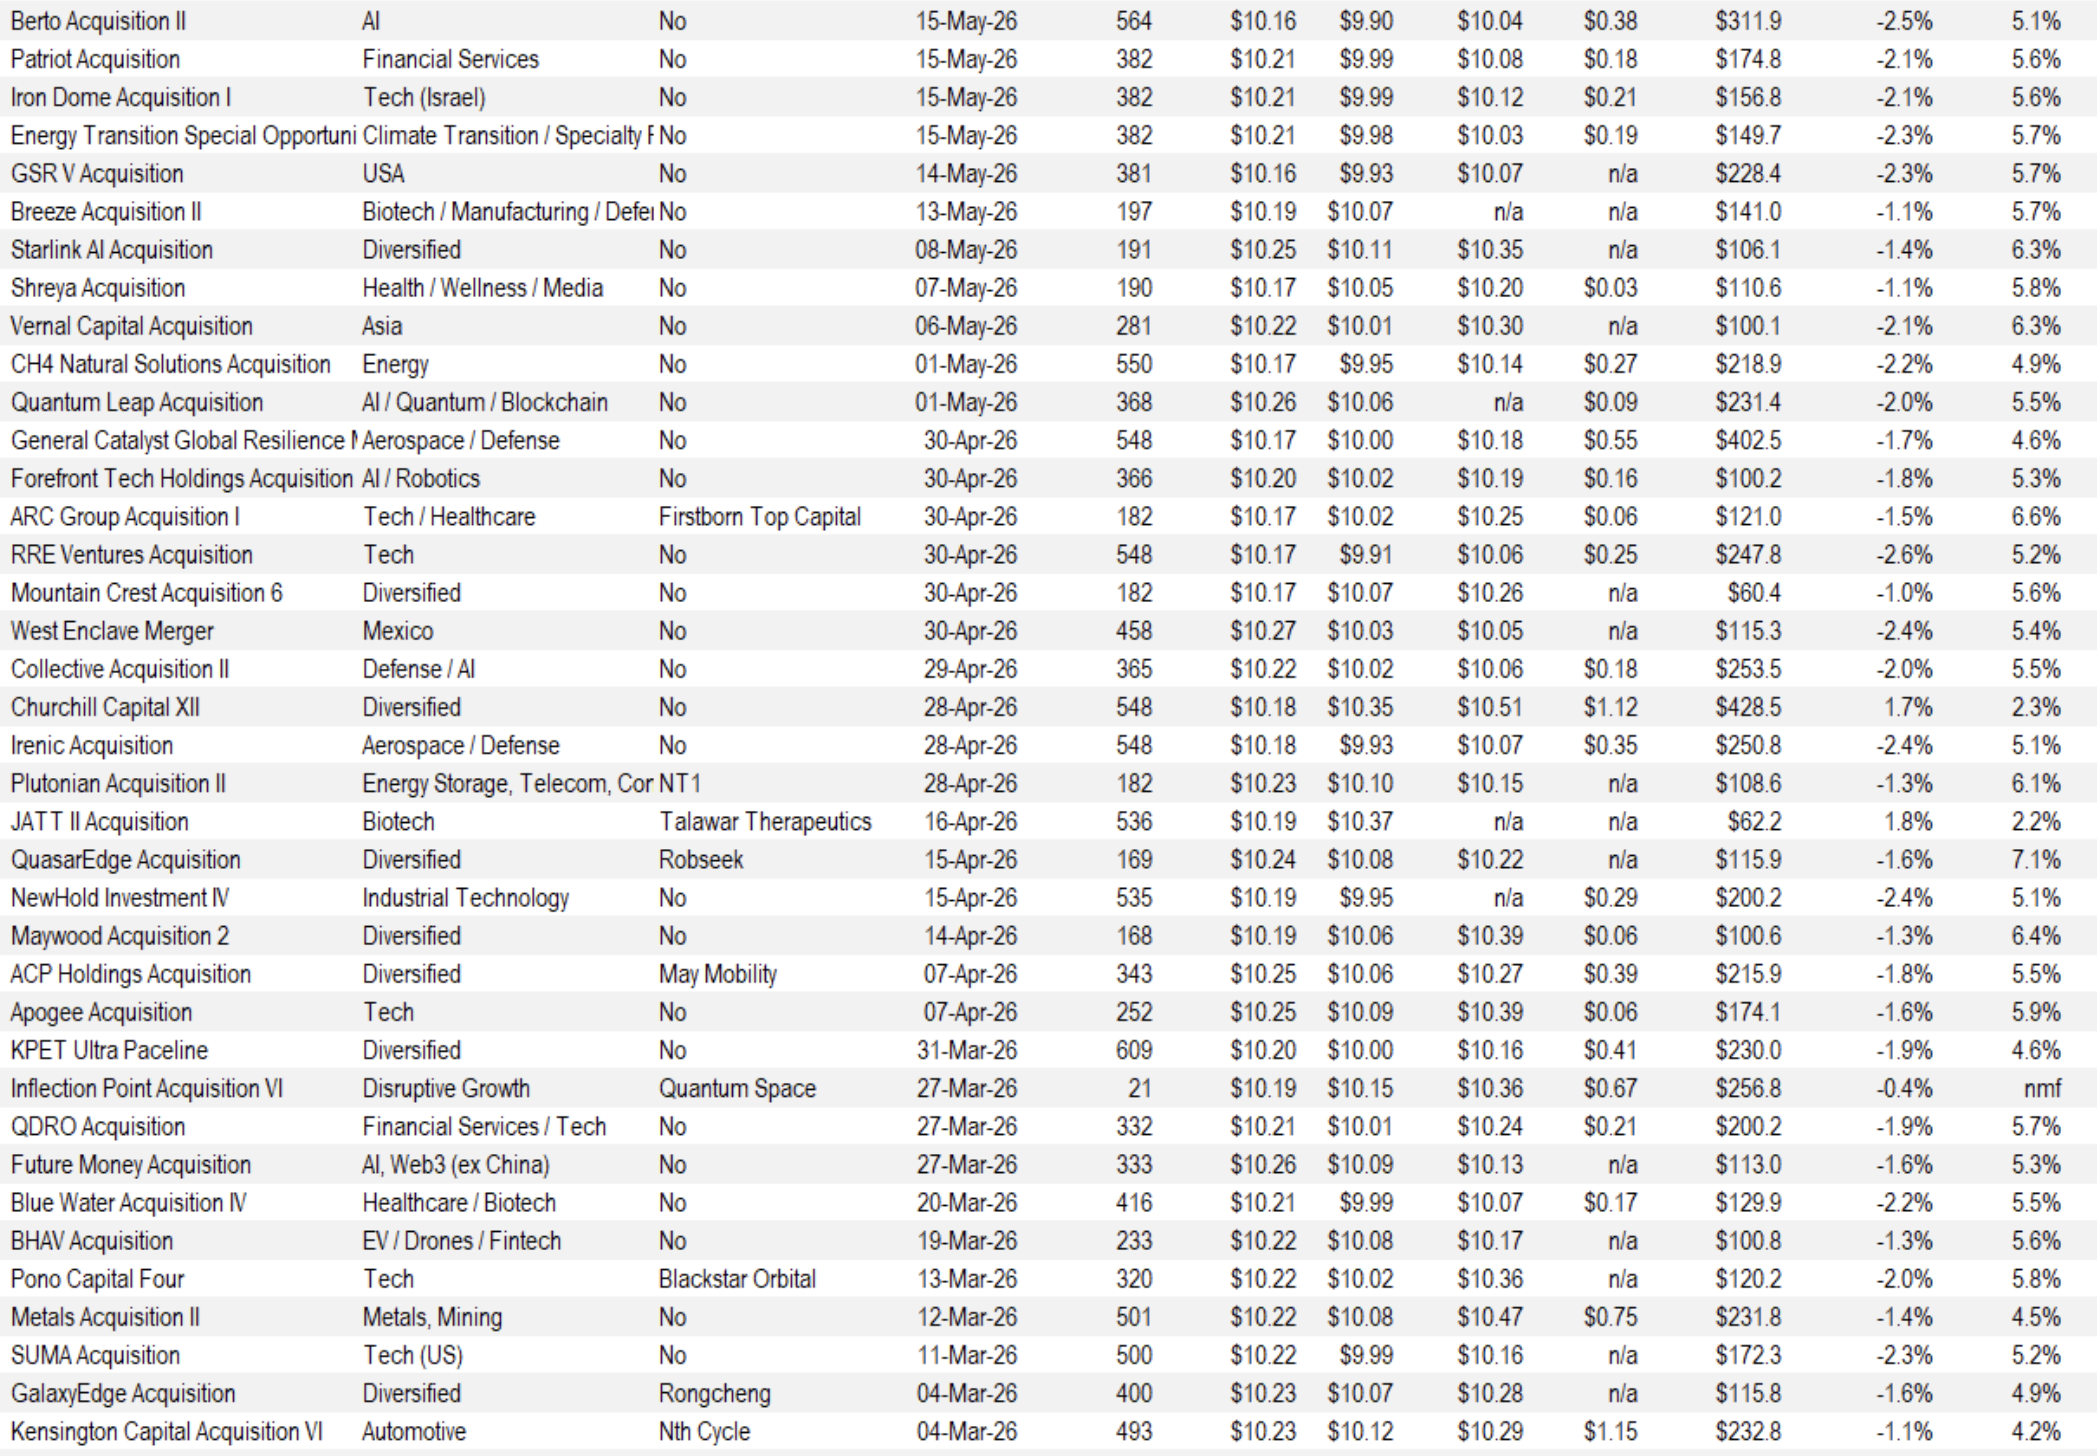
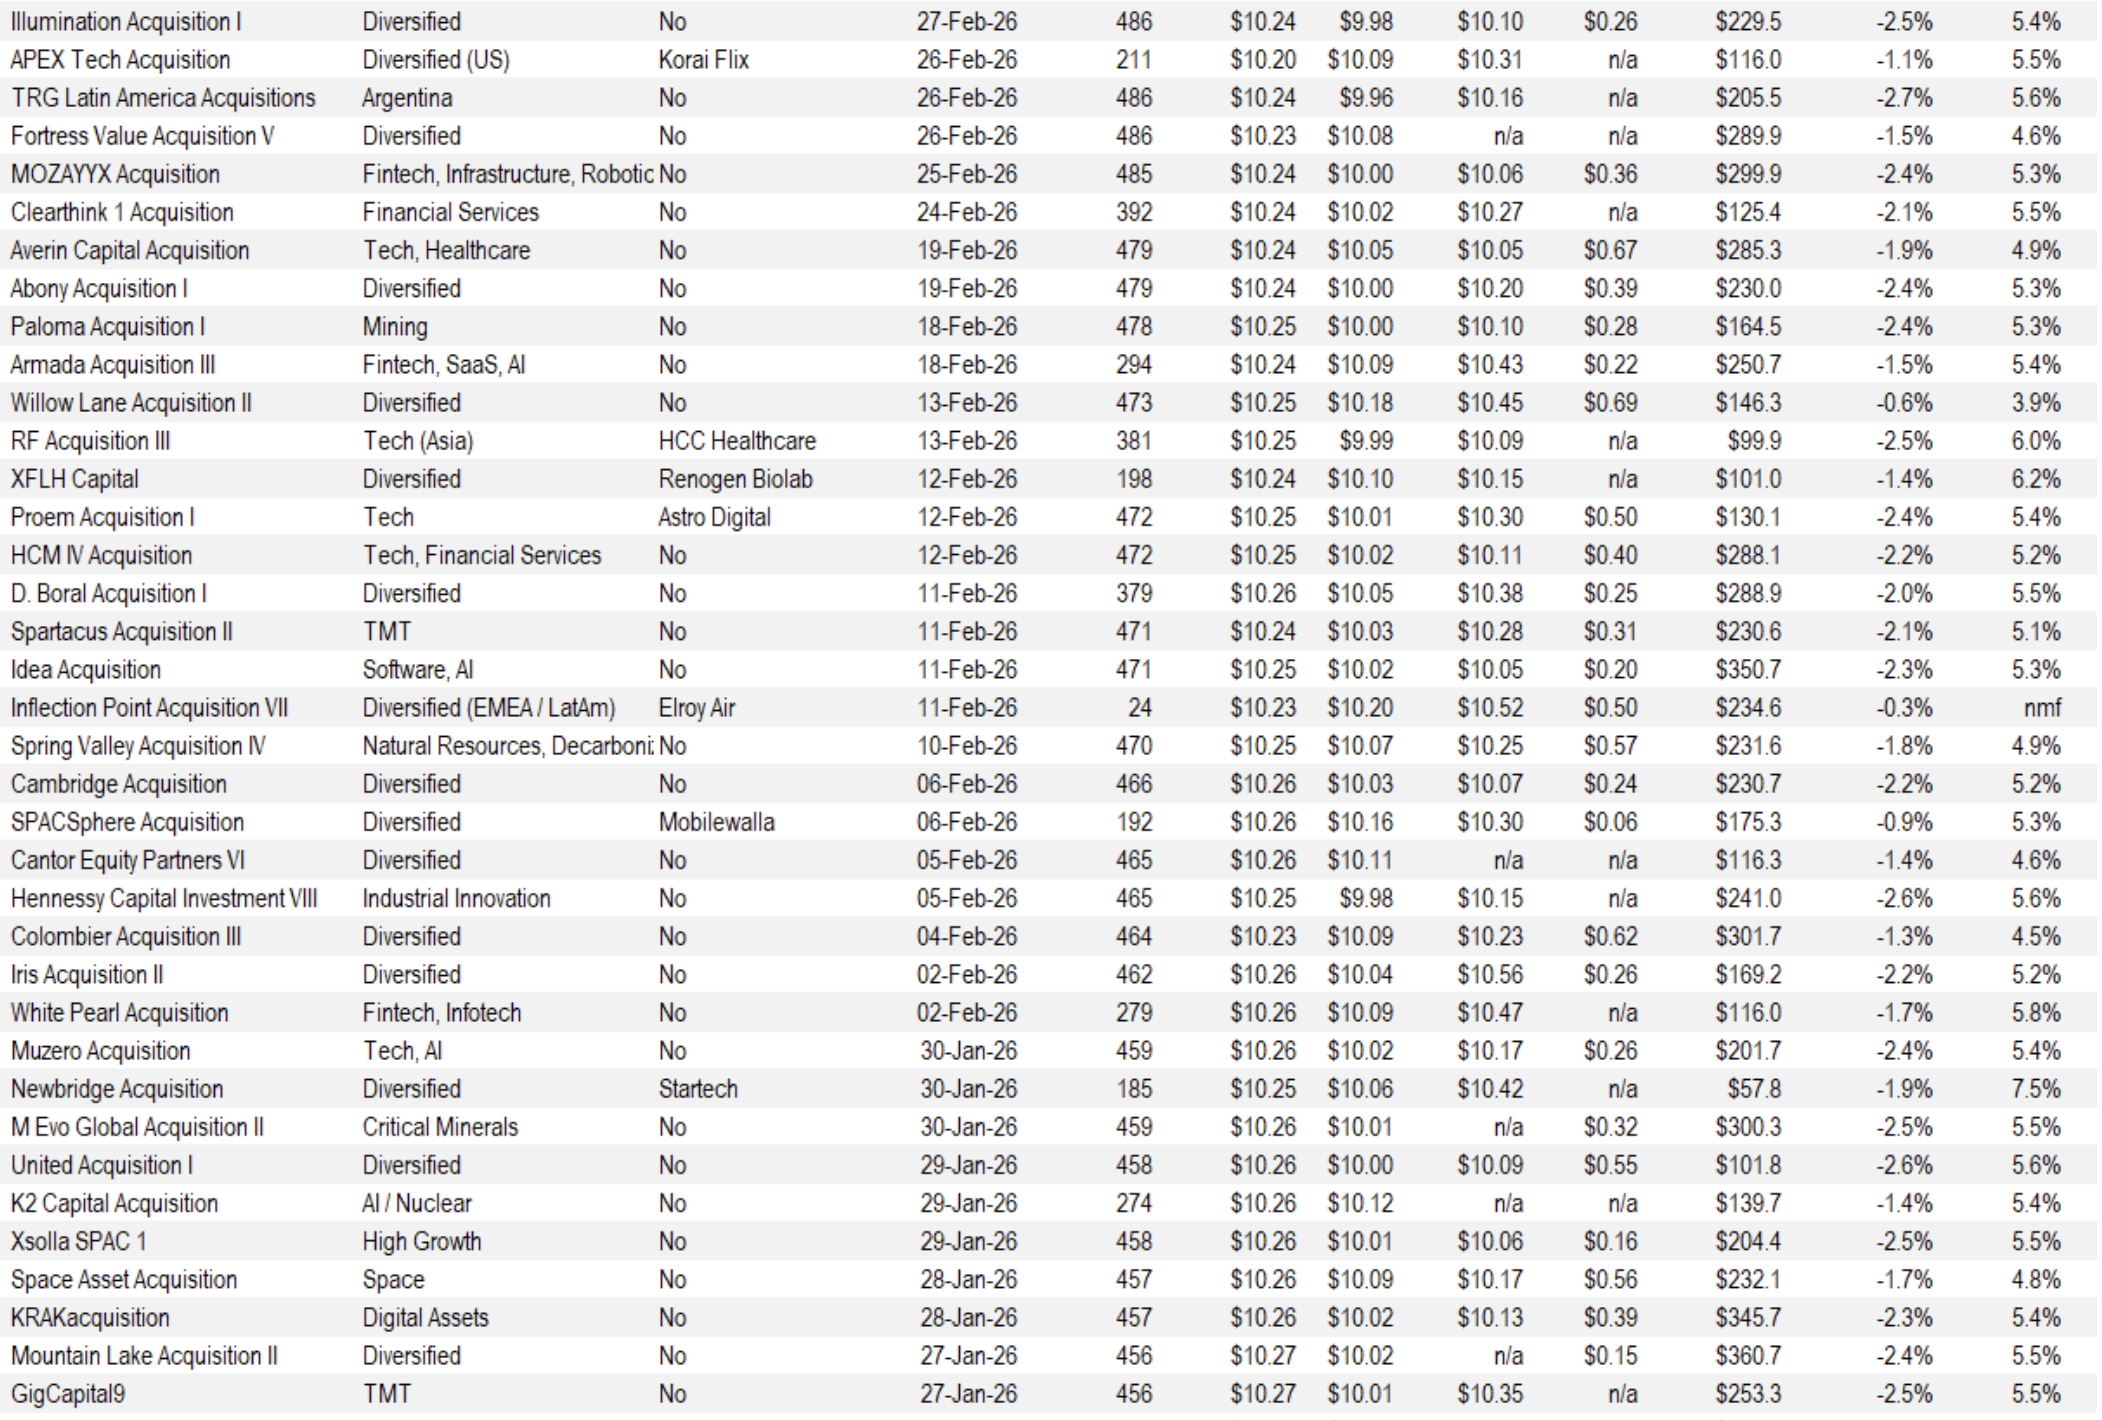
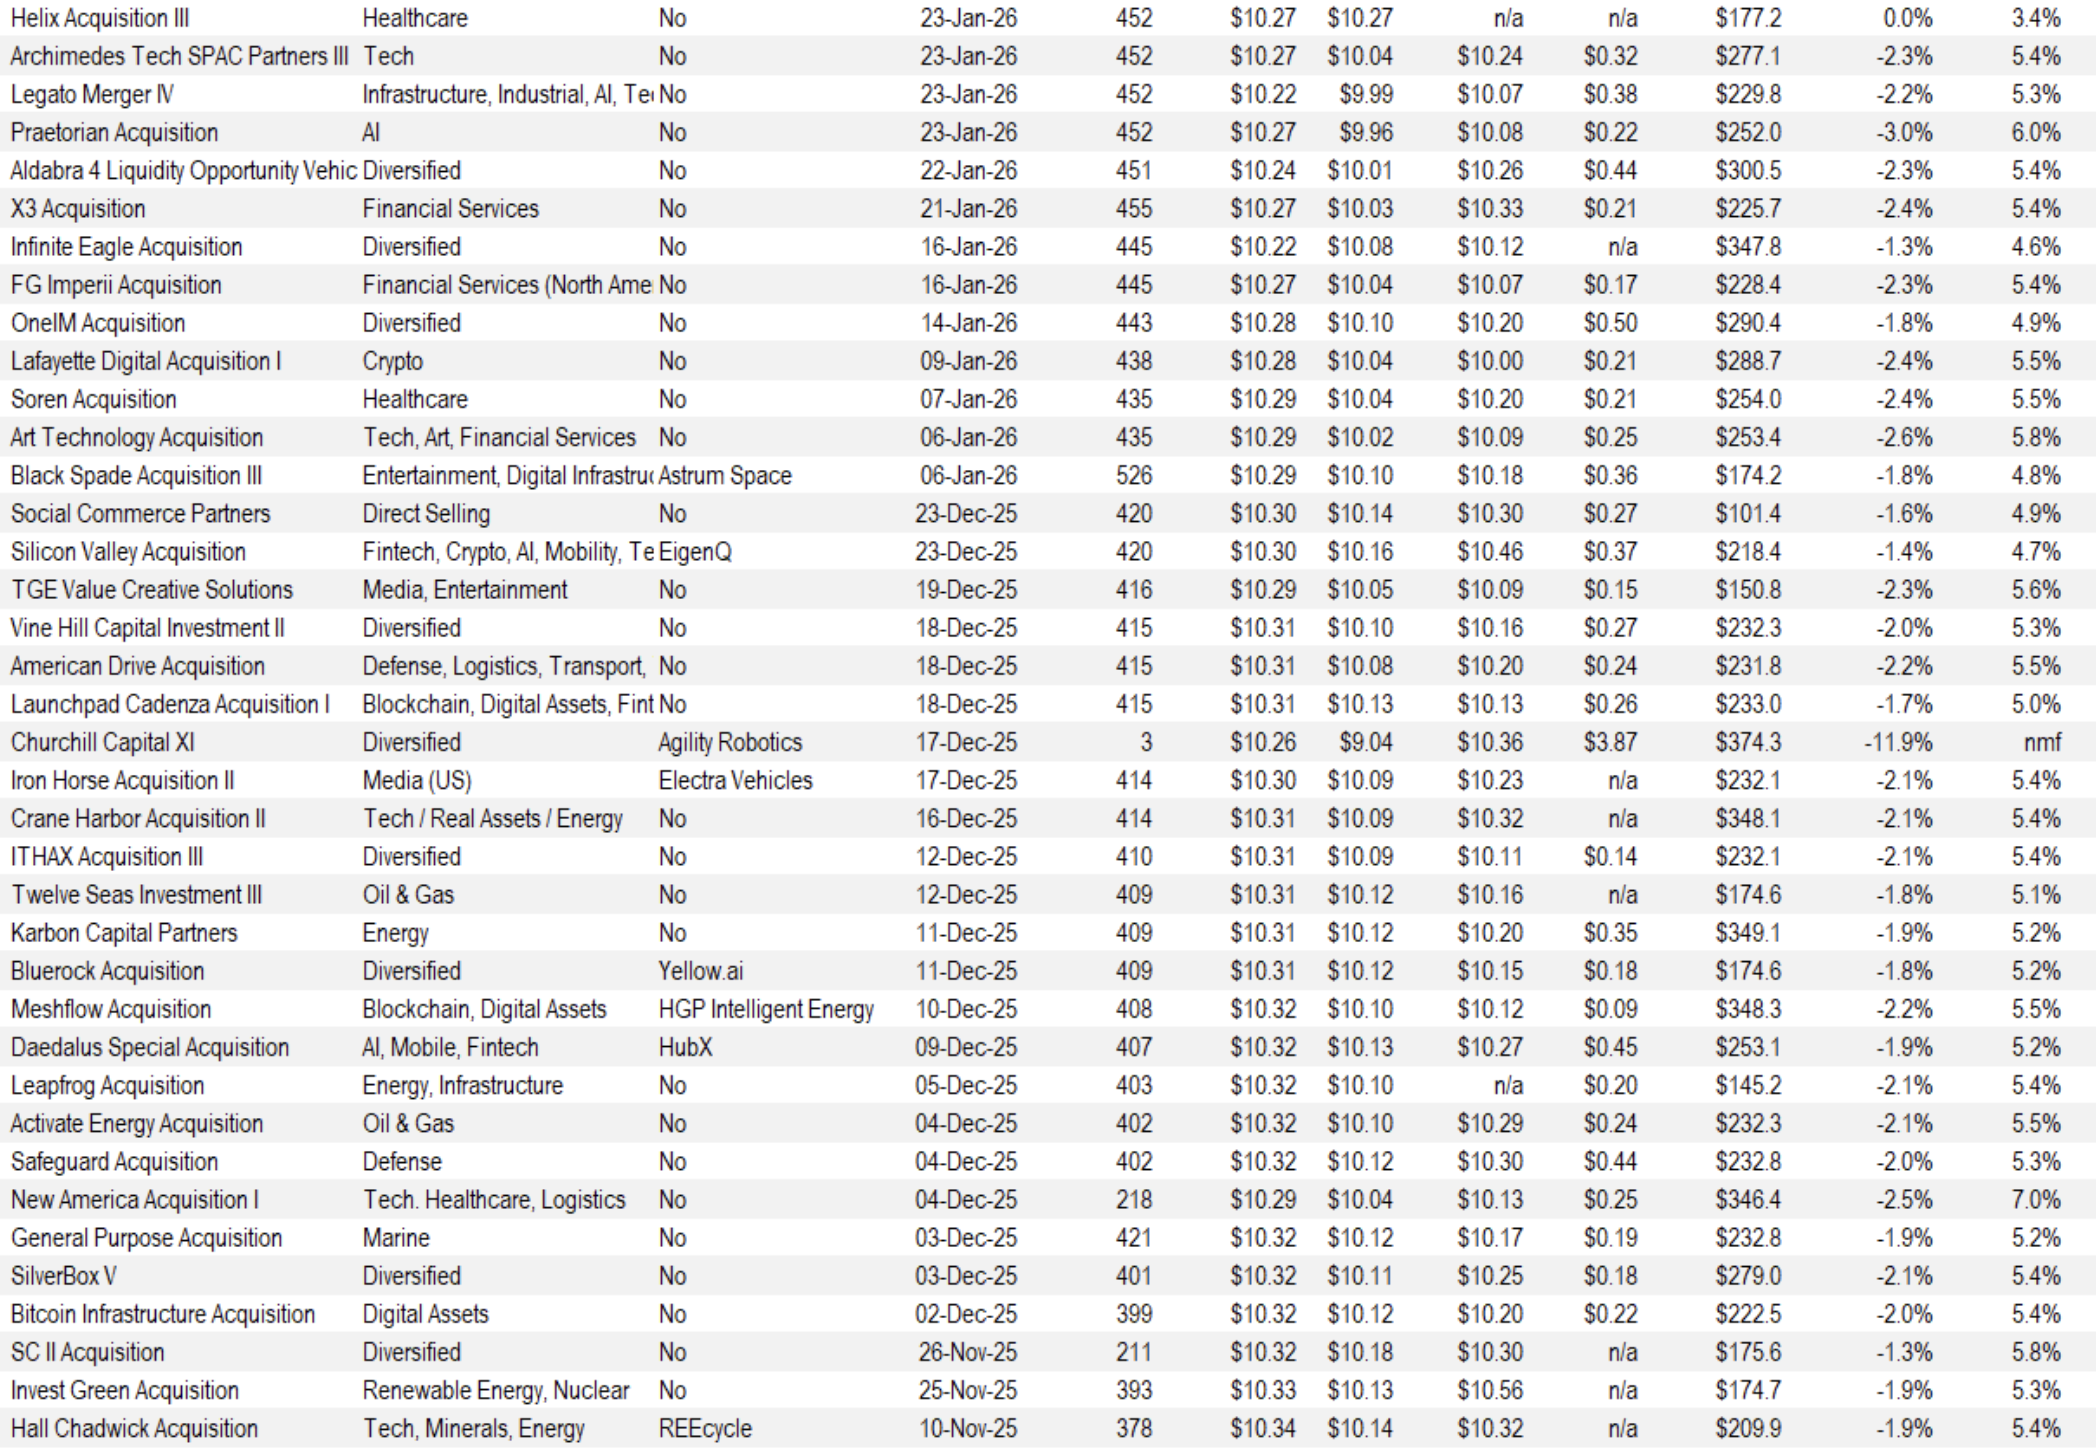
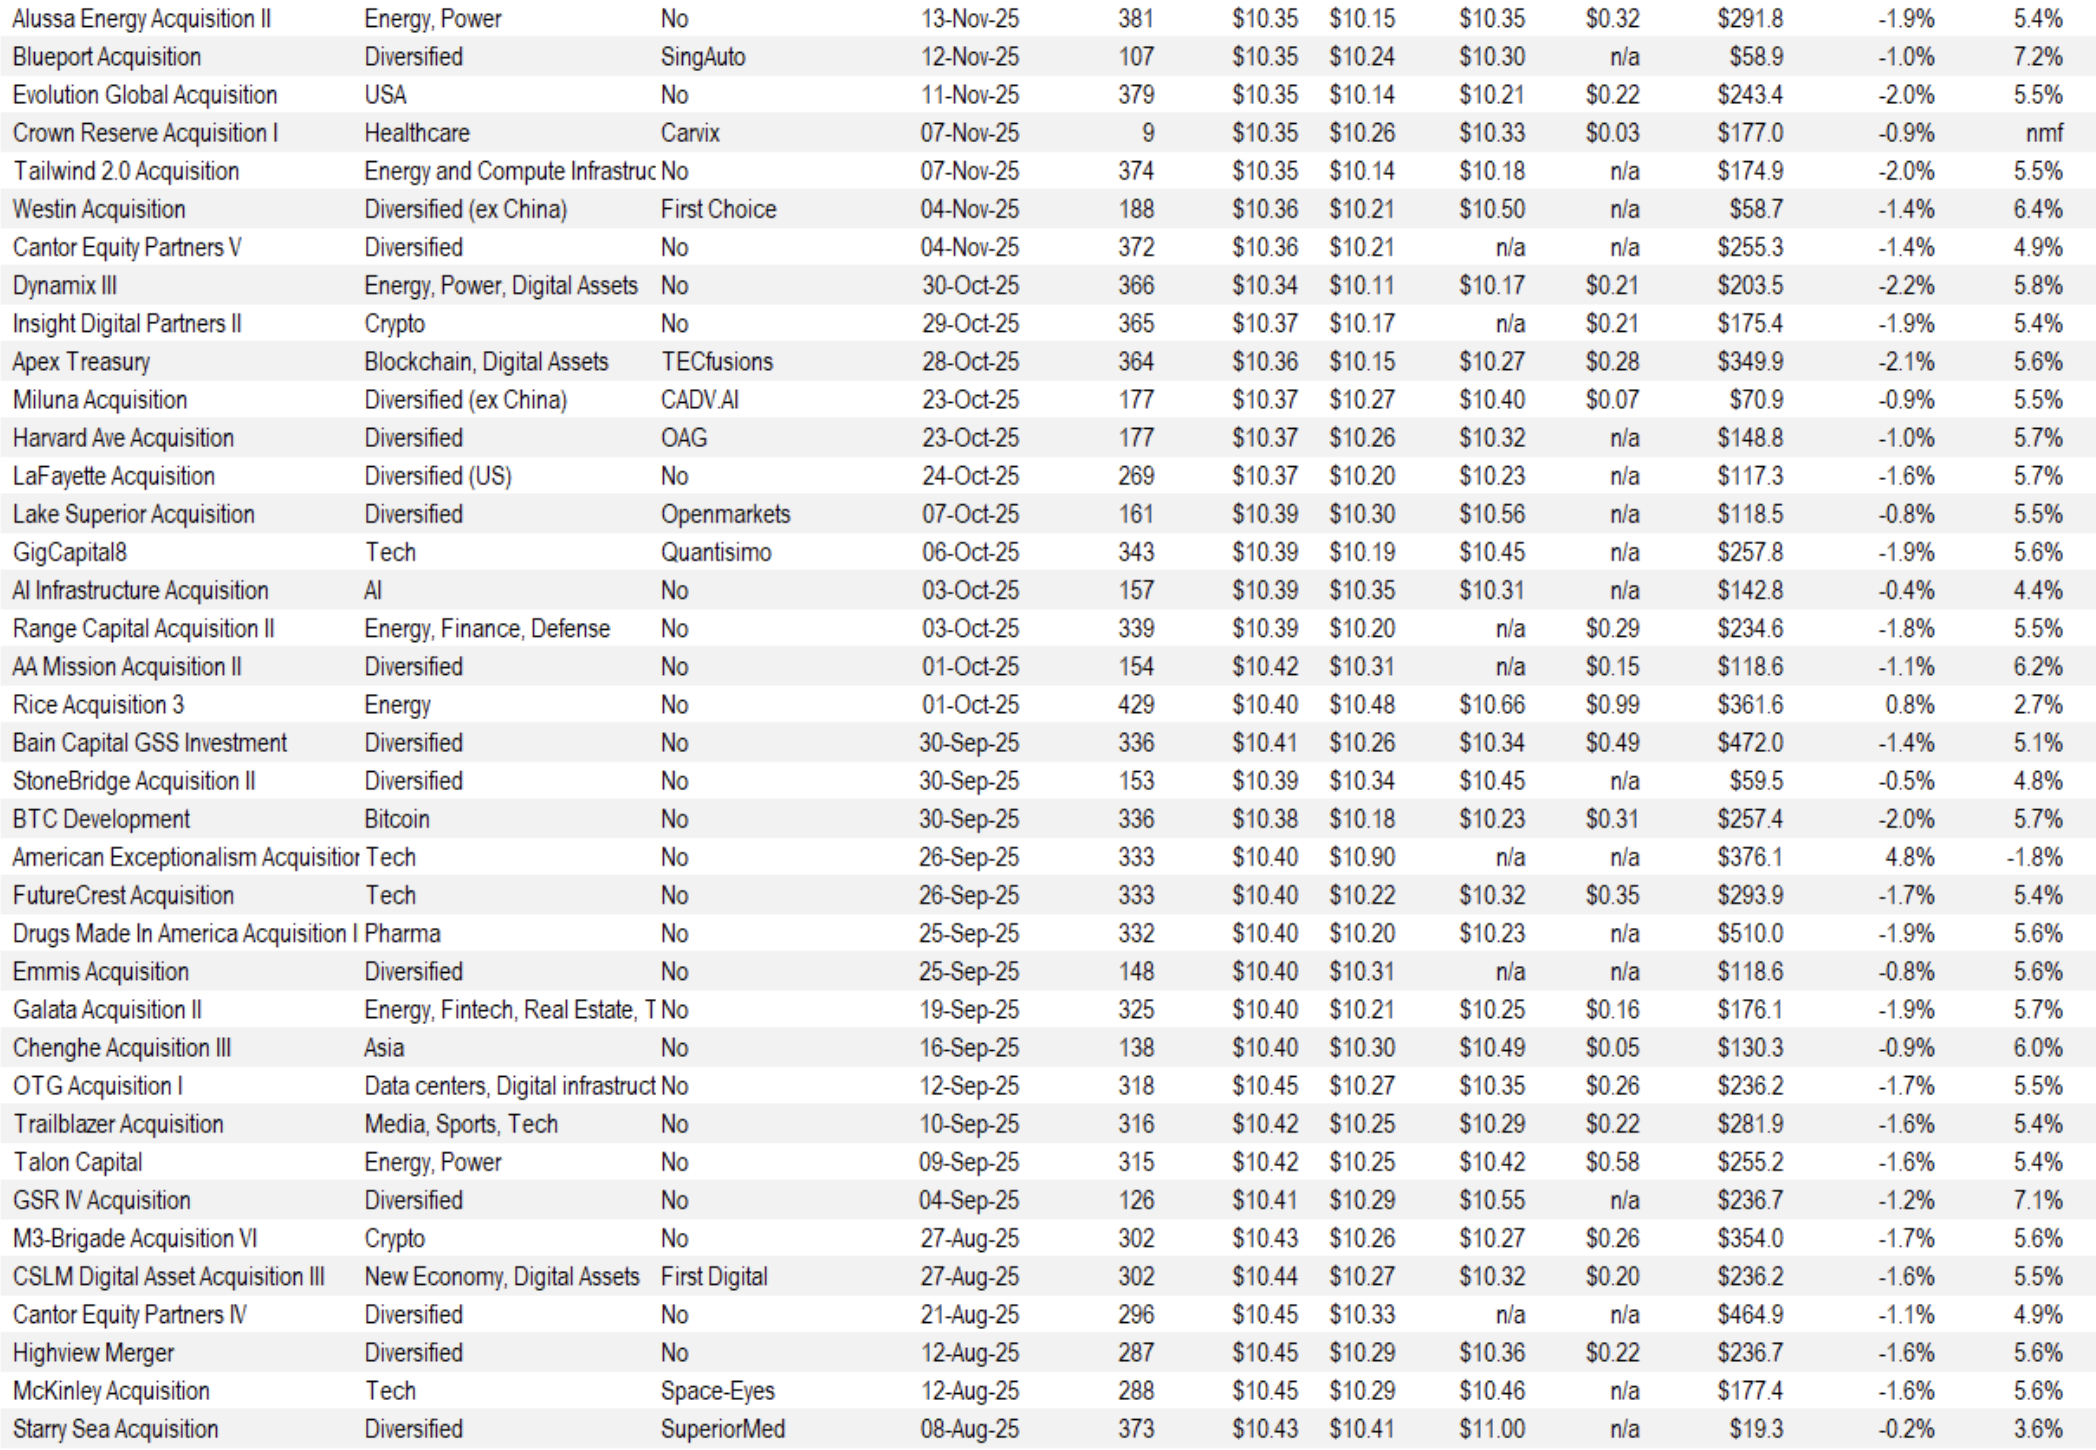
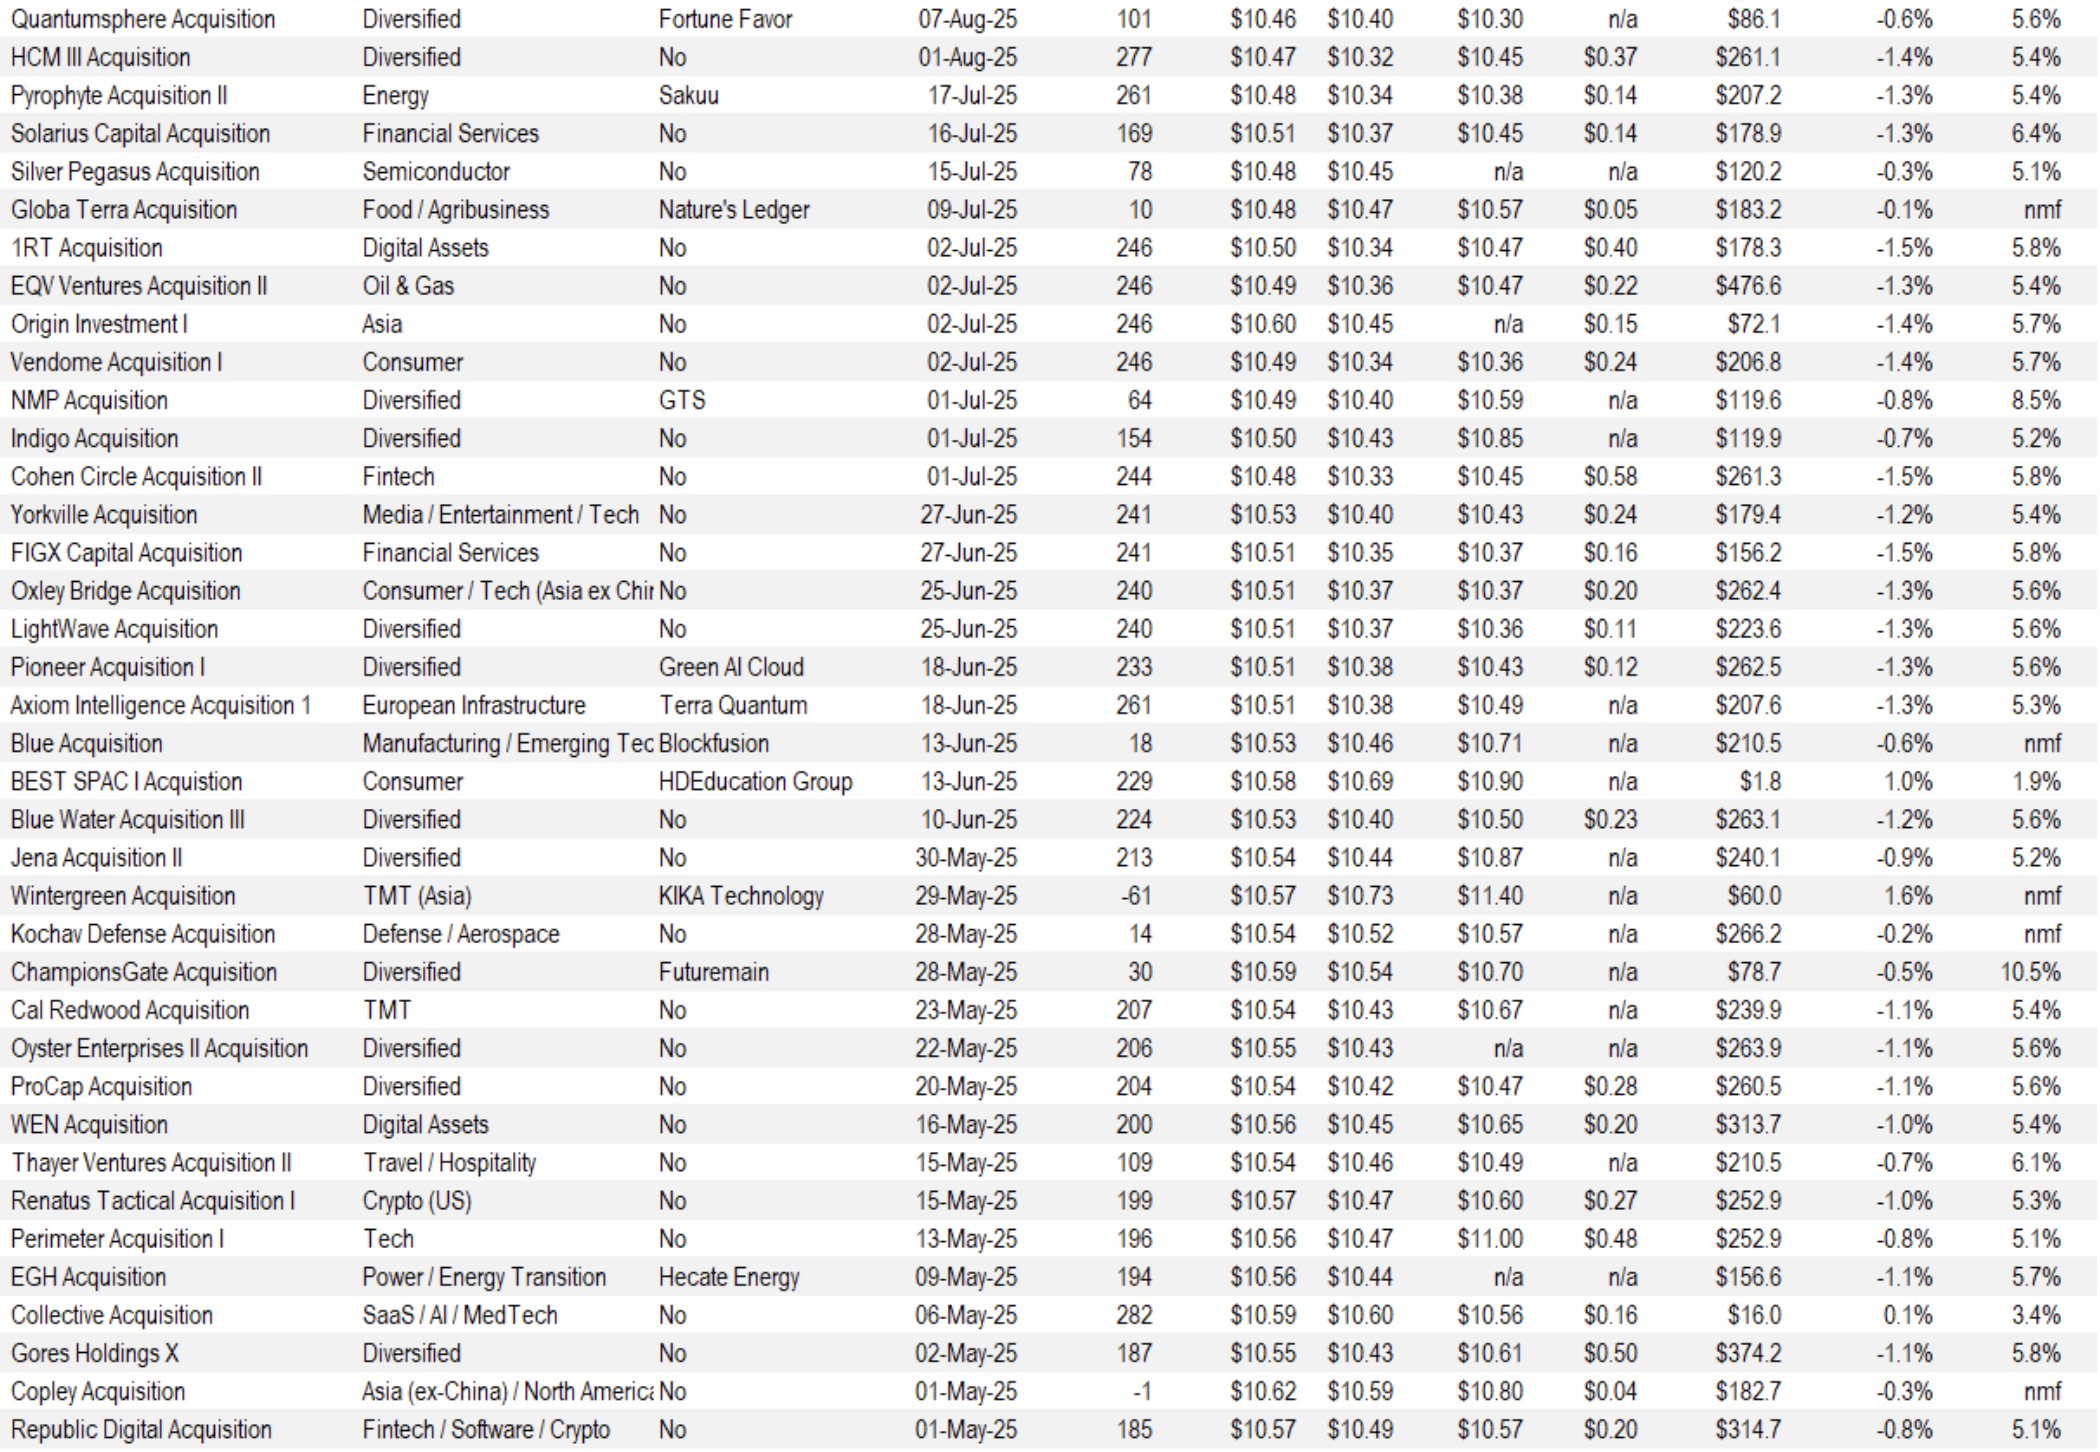
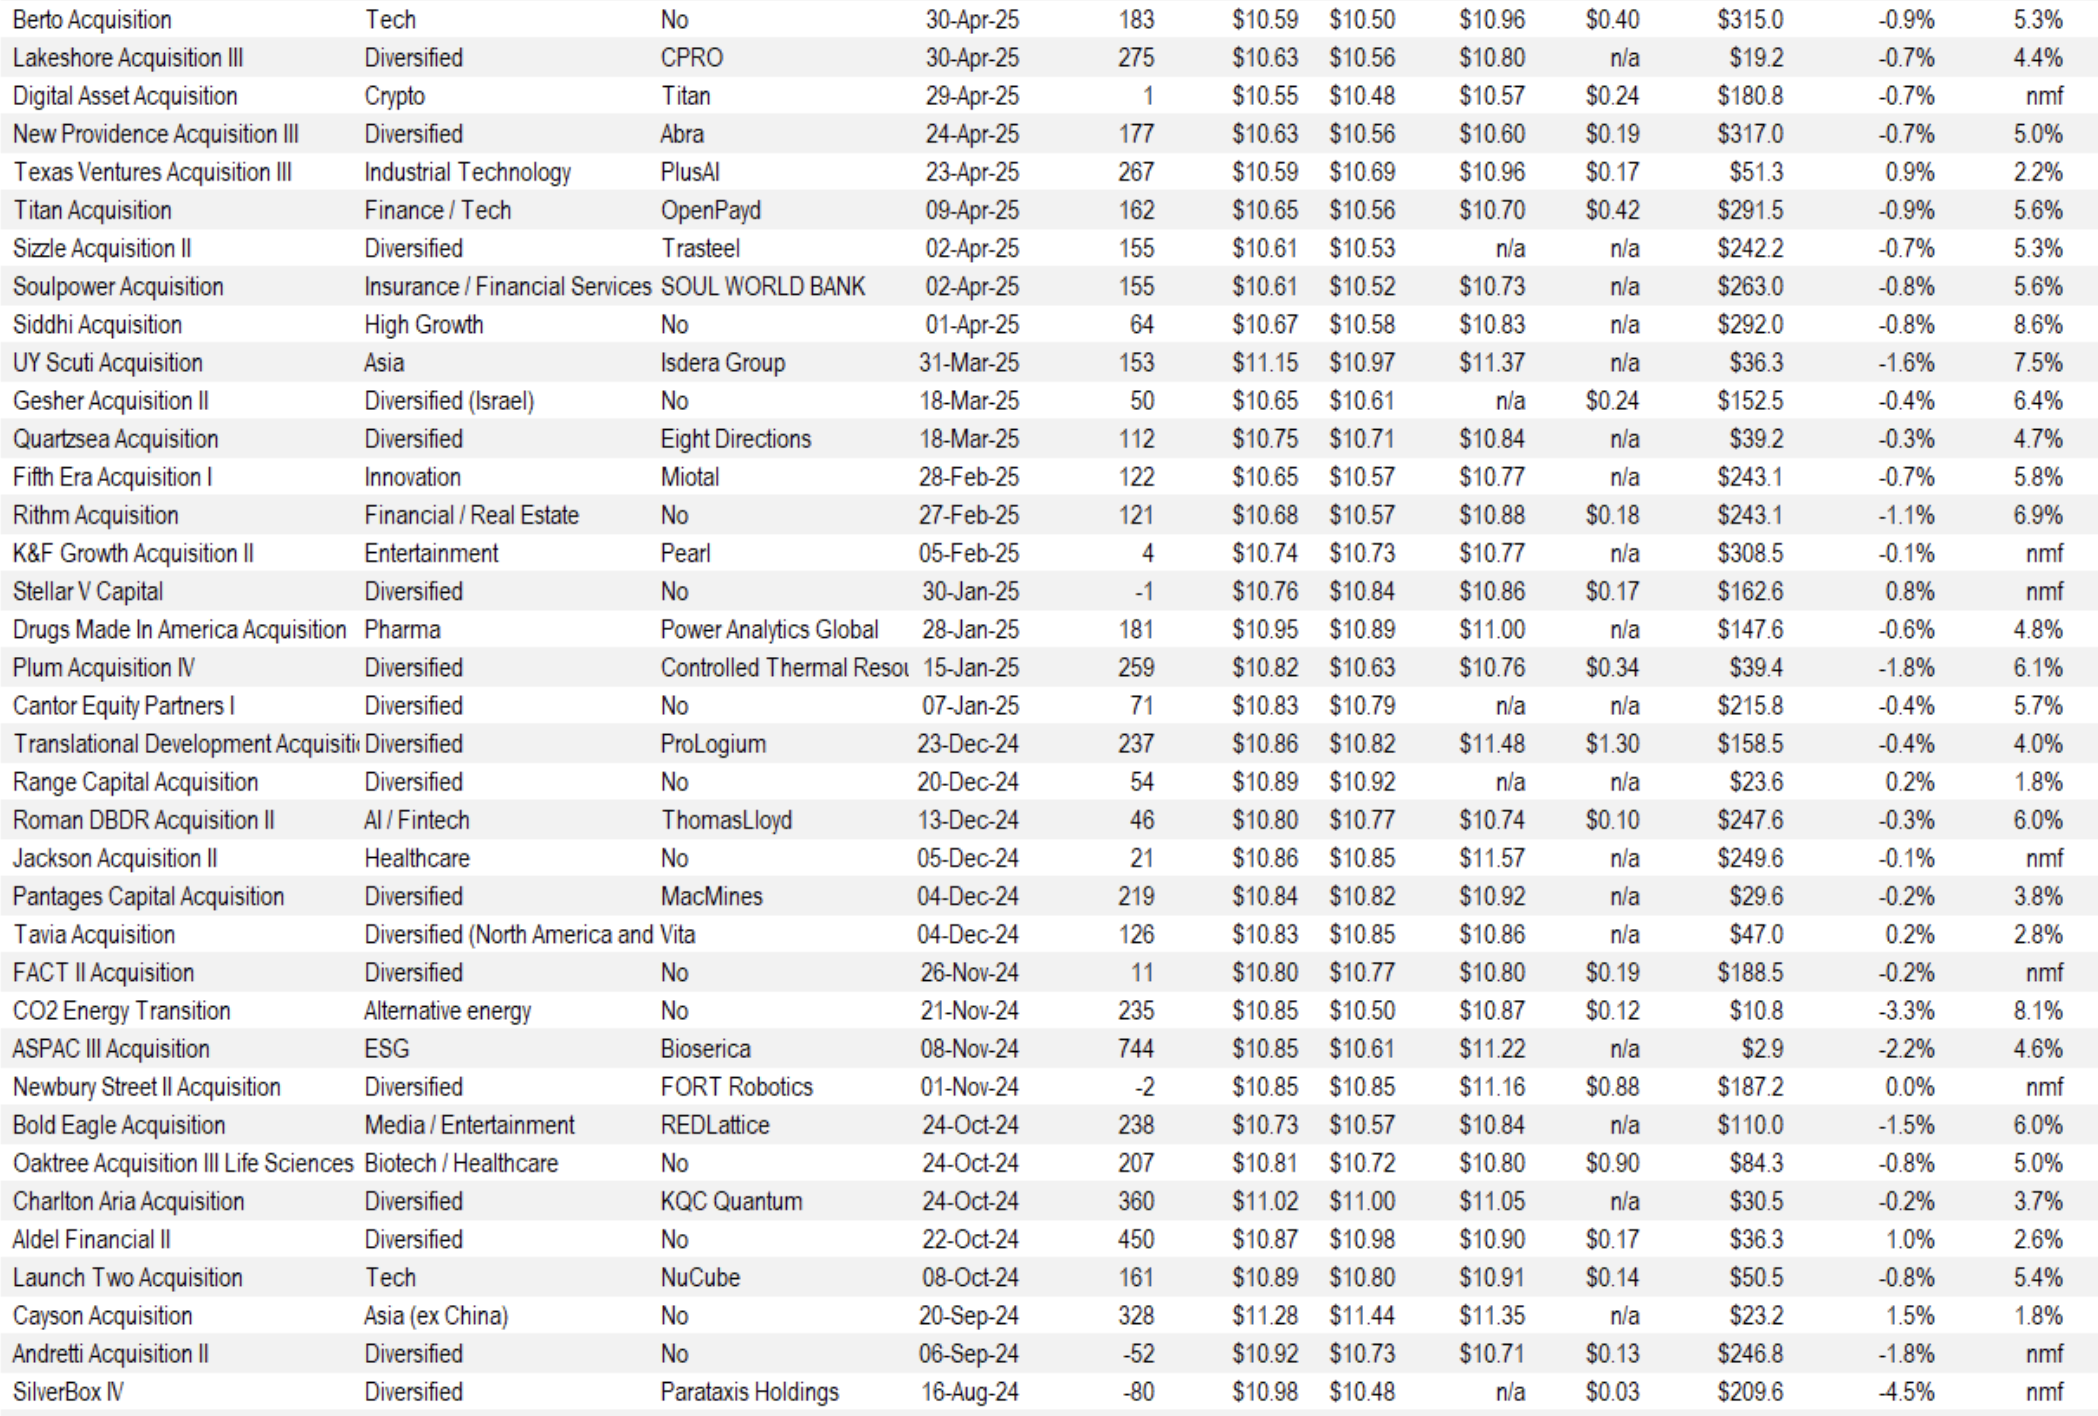
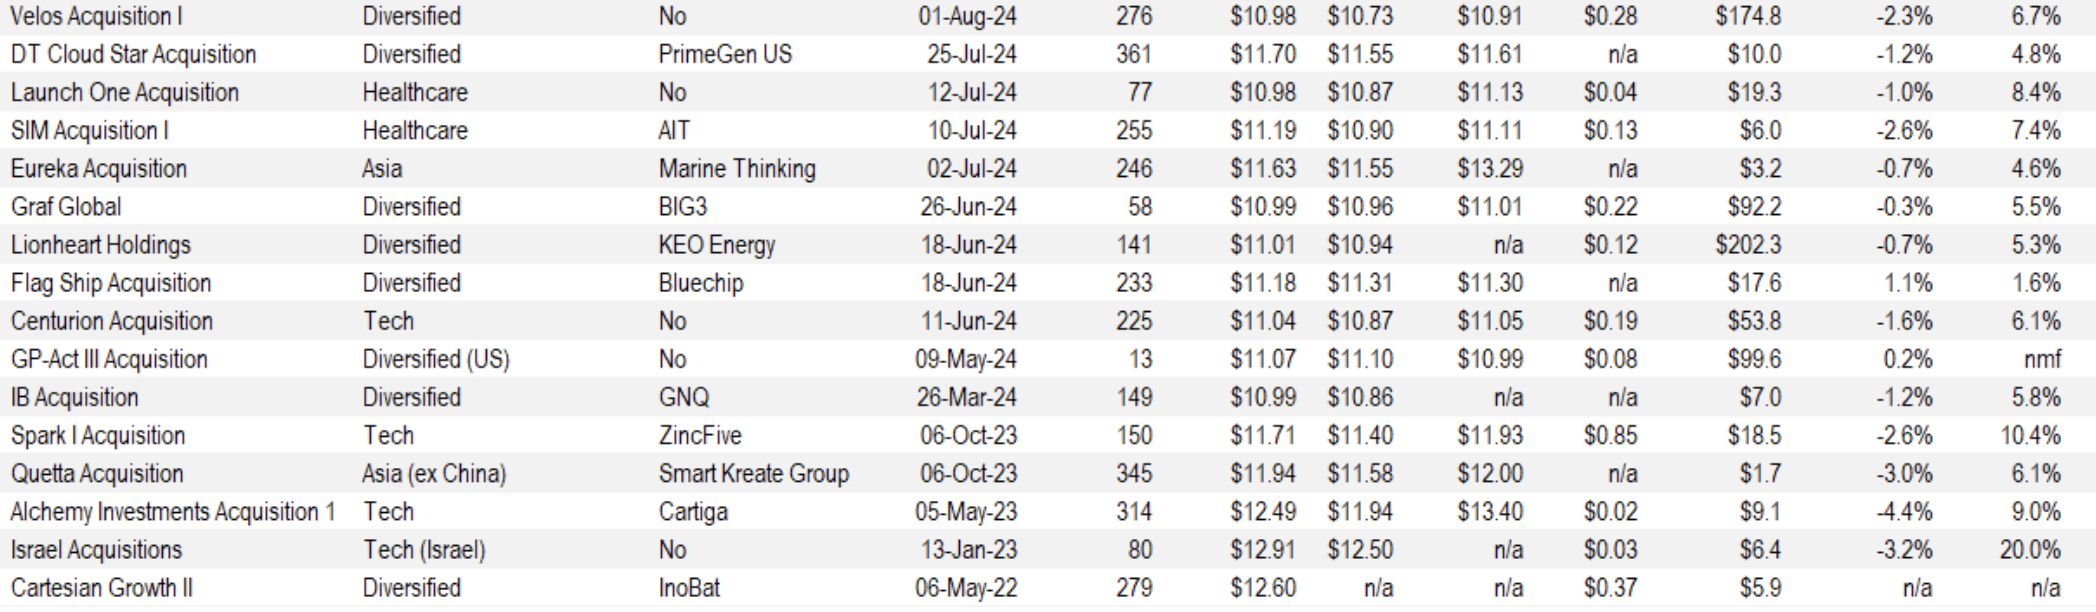
Each individual merger is assigned a risk rating:
- AA – a merger arbitrage rated ‘AA’ has the highest rating assigned by AlphaRank. The merger has the highest probability of closing.
- A – a merger arbitrage rated ‘A’ differs from the highest-rated mergers only by a small degree. The merger has a very high probability of closing.
- BBB – a merger arbitrage rated ‘BBB’ is of investment grade and has a high probability of closing.
- BB – a merger arbitrage rated ‘BB’ is somewhat speculative in nature and has a greater than 90% probability of closing.
- B – a merger arbitrage rated ‘B’ is speculative in nature and has a greater than 85% probability of closing.
- CCC – a merger arbitrage rated ‘CCC’ is very speculative in nature. The merger is subject to certain conditions that may not be satisfied.
- NR – a merger-rated NR is trading either at a premium to the implied consideration or a discount to the unaffected price.
The AlphaRank merger analytics database is utilized in running the Accelerate Arbitrage Fund (TSX: ARB), which may have positions in some of the securities mentioned.

* AlphaRank is exclusively produced by Accelerate Financial Technologies Inc. (“Accelerate”). Visit Alpharank.com for more information. Disclaimer: This research does not constitute investment, legal or tax advice. Data provided in this research should not be viewed as a recommendation or solicitation of an offer to buy or sell any securities or investment strategies. The information in this research is based on current market conditions and may fluctuate and change in the future. Accelerate does not accept any liability for any direct, indirect or consequential loss or damage suffered by any person as a result of relying on all or any part of this research and any liability is expressly disclaimed. Accelerate may have positions in securities mentioned. Past performance is not indicative of future results.