Accelerate Absolute Return Fund
About the Fund
The Accelerate Absolute Return Fund (TSX: HDGE, HDGE.U) is a quantitative long-short equity hedge fund that seeks to achieve attractive risk-adjusted returns with low correlation to the broad equity markets.
Investment Objectives
- Target 10-15% annualized returns
- Generate positive returns irrespective of market direction
- Hedge downside risk
- Manage volatility
- Provide uncorrelated returns
Accelerate Absolute Return Fund Explained:
HDGE TRADING DATA
SUBSCRIBE TO OUR DISTRIBUTION LIST TO STAY UPDATED ON HDGE
QUICK FACTS
Type:
Long-short equity
Structure:
Alternative ETF
Date Started:
May 10, 2019
Management Fee:
0.00%
Performance Fee:
20% of outperformance over high water mark
Investment Manager:
Accelerate Financial Technologies Inc.
Distribution:
$0.10 per quarter
Exchange:
TSX
Currency:
CAD
Risk Rating:
Medium
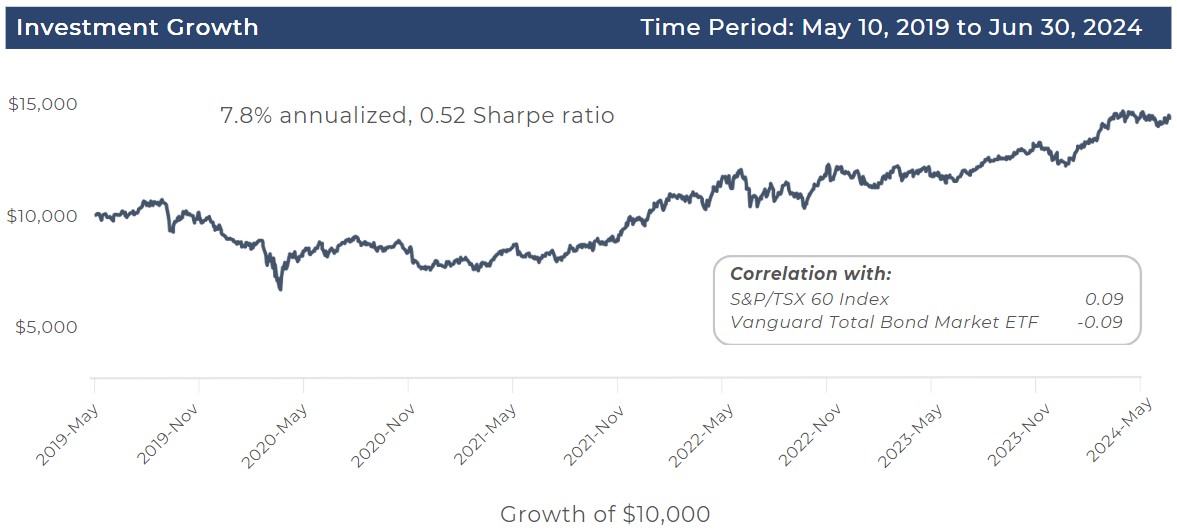
Track Record
Investment Process
- Value
- Quality
- Price Momentum
- Operating Momentum
- Trend
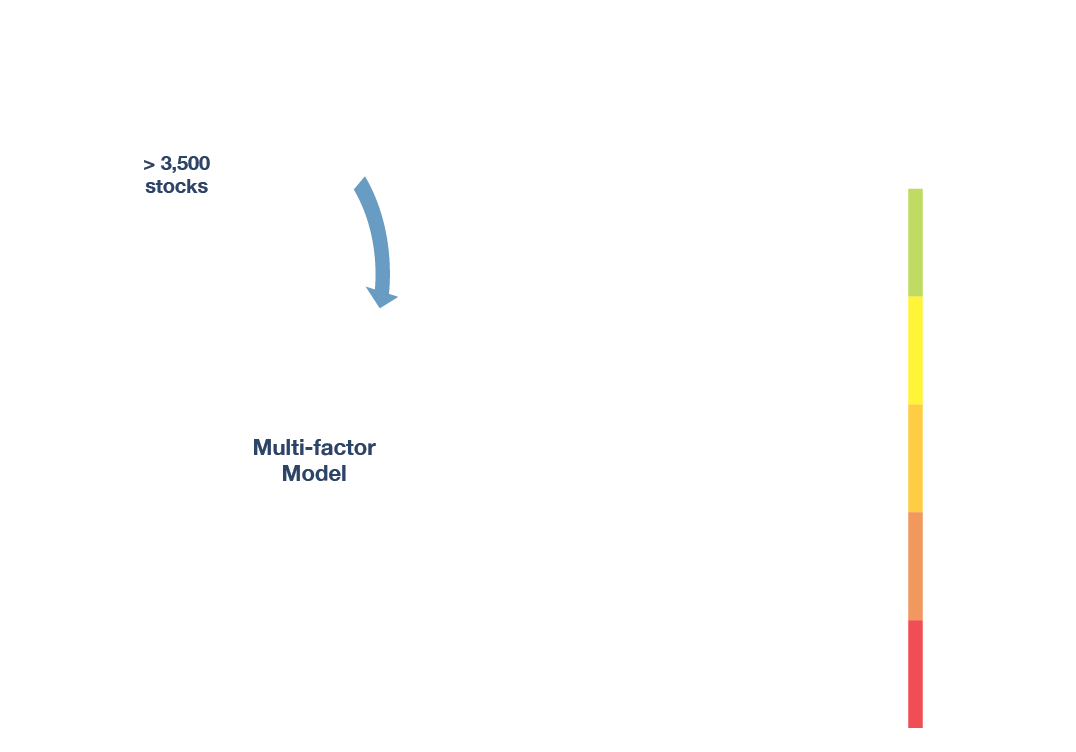
The Fund goes long a portfolio of the highest expected return stocks selected from the top decile ranking from the multi-factor model while going short a portfolio of the lowest expected return stocks selected from the bottom decile ranking. The portfolio is rebalanced on a monthly basis.
Performance as of 2024-Jun-28
| 1 Month | 3 Months | YTD | 1 Year | 3 Years | 5 Years | Since Inception | ||
|---|---|---|---|---|---|---|---|---|
| HDGE | 0.1% | 0.1% | 16.8% | 20.0% | 19.6% | 7.7% | 7.8% |
Fund Characteristics as of 2024-Jun-28
| Long | Short | |
|---|---|---|
| Number of Securities | 43 | 41 |
| Average Market Cap ($mm) | $18,414 | $4,411 |
| Beta | 1.0 | 1.3 |
| EBITDA/EV | 15.0% | 2.5% |
| FCF/EV | 12.0% | -7.0% |
| Trailing Return | 55.0% | -41.2% |
| Pct of 52 Week High | 93.7% | 51.7% |
| Return on Capital | 17.3% | -10.5% |
| Gross Profits/Assets | 6.5% | 3.8% |
| 50 DMA to 200 DMA | 118.3% | 84.4% |
| EPS Revision | 2.9% | -0.7% |
| Change In Shares | -2.8% | 3.1% |
| Earnings Abnormal Return | 4.0% | -5.5% |
Sector Weightings as of 2024-Jun-28
| Long | Short | |
|---|---|---|
| Communication Services | 0.0% | -1.1% |
| Consumer Discretionary | 10.1% | -2.3% |
| Consumer Staples | 4.9% | -1.1% |
| Energy | 15.2% | -1.1% |
| Financials | 17.4% | -5.6% |
| Health Care | 10.1% | -5.6% |
| Industrials | 20.1% | -9.9% |
| Information Technology | 17.5% | -12.5% |
| Materials | 7.4% | -5.6% |
| Real Estate | 2.5% | -1.1% |
| Utilities | 2.5% | 0.0% |
| Equity Exposure | 107.9% | -45.9% |
Fund Holdings as of 2024-Jun-28
| Long Security Name | Weight | |
|---|---|---|
| VAALCO Energy Inc | 2.7% | |
| Williams-Sonoma Inc | 2.6% | |
| Cirrus Logic Inc | 2.6% | |
| Brightsphere Investment Group | 2.6% | |
| Reinsurance Group of America Inc | 2.6% | |
| QUALCOMM Inc | 2.6% | |
| Owens Corning | 2.6% | |
| Zimvie Inc | 2.6% | |
| Tenet Healthcare Corp | 2.5% | |
| Leonardo DRS Inc | 2.5% | |
| Primaris Real Estate Investment Trust | 2.5% | |
| Griffon Corp | 2.5% | |
| Cabot Corp | 2.5% | |
| Credo Technology Group Holding | 2.5% | |
| CES Energy Solutions Corp | 2.5% | |
| SM Energy Co | 2.5% | |
| Paysafe Ltd | 2.5% | |
| NRG Energy Inc | 2.5% | |
| Insight Enterprises Inc | 2.5% | |
| EMCOR Group Inc | 2.5% | |
| DaVita Inc | 2.5% | |
| Geopark Ltd | 2.5% | |
| J Jill Inc | 2.5% | |
| Converge Technology Solutions | 2.5% | |
| GE HealthCare Technologies Inc | 2.5% | |
| Safe Bulkers Inc | 2.5% | |
| Masterbrand Inc | 2.5% | |
| Grand Canyon Education Inc | 2.5% | |
| Loblaw Cos Ltd | 2.5% | |
| Global Ship Lease Inc | 2.5% | |
| Stellantis NV | 2.5% | |
| Tamarack Valley Energy Ltd | 2.5% | |
| Synchrony Financial | 2.5% | |
| Markel Group Inc | 2.5% | |
| Argan Inc | 2.5% | |
| Clearwater Paper Corp | 2.5% | |
| Trican Well Service Ltd | 2.4% | |
| George Weston Ltd | 2.4% | |
| Mercury General Corp | 2.4% | |
| GoDaddy Inc | 2.4% | |
| Centerra Gold Inc | 2.4% | |
| Progressive Corp/The | 2.4% | |
| AppLovin Corp | 2.4% |
| Short Security Name | Weight | |
|---|---|---|
| MaxLinear Inc | -1.2% | |
| Navitas Semiconductor Corp | -1.2% | |
| Cracker Barrel Old Country Store Inc | -1.2% | |
| Wolfspeed Inc | -1.2% | |
| Radius Recycling Inc | -1.2% | |
| Portillos Inc | -1.2% | |
| ADTRAN Holdings Inc | -1.2% | |
| Amplitude Inc | -1.2% | |
| CEVA Inc | -1.2% | |
| Green Dot Corp | -1.2% | |
| Definitive Healthcare Corp | -1.2% | |
| JetBlue Airways Corp | -1.2% | |
| Methode Electronics Inc | -1.1% | |
| FirstService Corp | -1.1% | |
| Clean Energy Fuels Corp | -1.1% | |
| ARMOUR Residential REIT Inc | -1.1% | |
| Remitly Global Inc | -1.1% | |
| Bridge Investment Group Holdings | -1.1% | |
| CryoPort Inc | -1.1% | |
| Nevro Corp | -1.1% | |
| 3D Systems Corp | -1.1% | |
| P10 Inc | -1.1% | |
| Allegiant Travel Co | -1.1% | |
| Ballard Power Systems Inc | -1.1% | |
| Freshworks Inc | -1.1% | |
| Albemarle Corp | -1.1% | |
| Mercury Systems Inc | -1.1% | |
| Thoughtworks Holding Inc | -1.1% | |
| Knight-Swift Transportation Holdings Inc | -1.1% | |
| Compass Minerals International | -1.1% | |
| Darling Ingredients Inc | -1.1% | |
| Interfor Corp | -1.1% | |
| Fulgent Genetics Inc | -1.1% | |
| Spirit AeroSystems Holdings Inc | -1.1% | |
| Novagold Resources Inc | -1.1% | |
| Paragon 28 Inc | -1.1% | |
| Viasat Inc | -1.1% | |
| Stratasys Ltd | -1.1% | |
| SolarEdge Technologies Inc | -1.1% | |
| Perion Network Ltd | -1.1% | |
| Boeing Co | -1.0% | |
DISCLAIMER: This information on this web page does not constitute investment, legal or tax advice. Performance is inclusive of reinvested distributions. Past performance is not indicative of future results. Any data provided on this web page should not be viewed as a recommendation or solicitation of an offer to buy or sell any securities or investment strategies. The information on this web page is based on market conditions and may fluctuate and change without notice. Accelerate does not accept any liability for any direct, indirect or consequential loss or damage suffered by any person as a result of relying on all or any part of this website and any liability is expressly disclaimed.

