

![]()
December 10, 2019 – Investors are always looking for what I call the “holy grail” investment, meaning a strategy that earns high returns with low volatility and no down years.
Obviously, the expectation of a holy grail portfolio is unreasonable. Markets don’t work like that. Risk and return tend to be joined at the hip. Historically, asset classes with higher returns generally come with higher risk, be it measured as volatility or the probability of losing money. A high-returning strategy with no risk is just not realistic and if you find one, it would be best to run away as fast as you can.
How to Measure the Top Performing Strategies
For the past 11 years, global stocks have performed exceptionally well. Being long the broad based index has gone in investors’ favour. Not only that, a simple equity index has beaten the vast majority of active long-only mutual funds over both the short and long term.
Passive stock index performance has been so good that index funds have become larger than actively managed mutual funds for the first time ever. This trend will only continue.
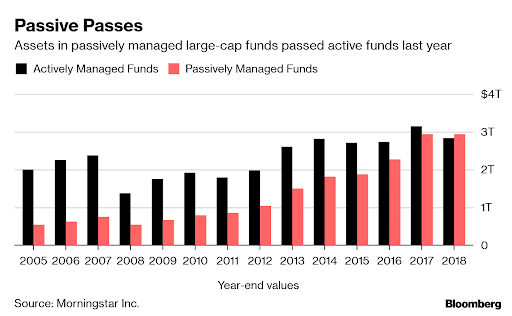
Global stocks, as measured by the MSCI All Country World Index (ACWI), have returned about 10% annually since 2009. A 10% annualized return is a great result, enough to double your money after about seven years. The MSCI ACWI’s return topped the average hedge fund strategy over the past 11 years, as seen in the chart below.
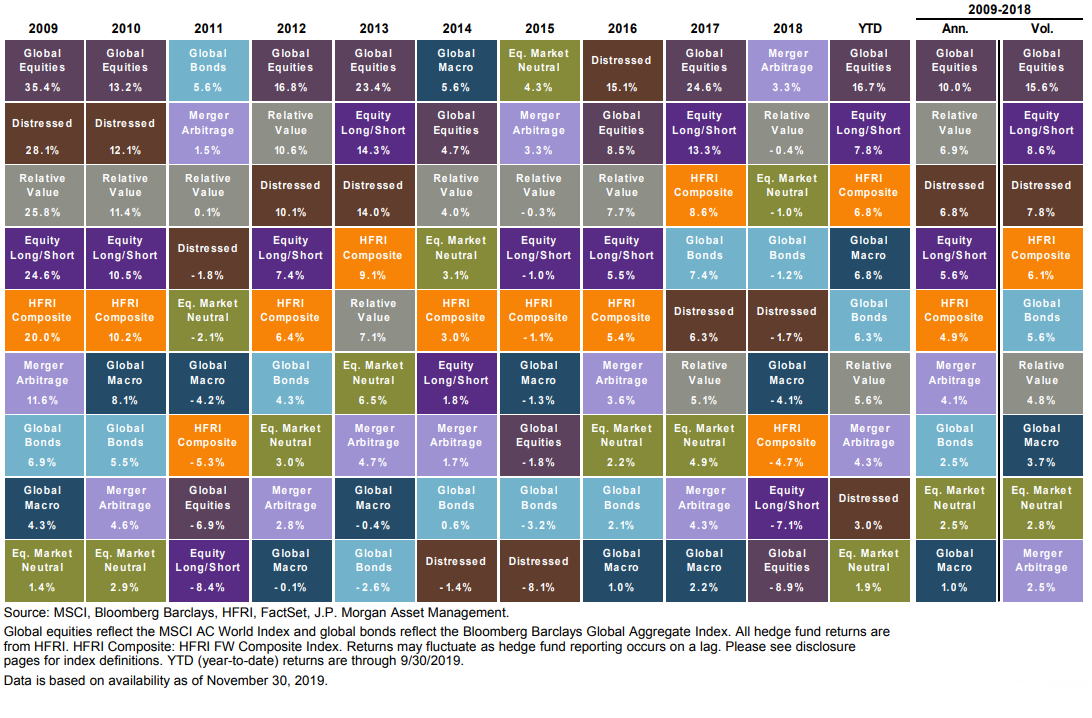
Source: J.P. Morgan Asset Management
That being said, the MSCI ACWI’s 10% annual compound growth rate came at a cost, given the significant amount of volatility. Since 2009, the MSCI had an annual standard deviation of nearly 16%. This volatility brought three bear markets (referring to a drop of -20% or greater), in 2011, 2015 and 2018.
Comparing performance across asset classes, global equities did have the highest return. However, it’s important to note that the MSCI ACWI did not have the best performance.
Confused? Let me explain.
Given that return and risk are joined at the hip, you cannot look at one without the other. The performance of an investment strategy must be viewed in the context of risk. From a quantitative standpoint, one way to measure risk is the annualized volatility of an investment strategy.
The correct way to measure and compare performance is to look at risk-adjusted performance, meaning the return per unit of risk. For this, we utilize a simple formula called the Sharpe ratio, which looks at annualized return divided by the annualized standard deviation of the investment strategy.
Consistency Matters
Getting back to our “holy grail” portfolio of high returns with low risk, judging by the table of returns above, we realize that it’s just not possible with the available asset classes.
Global equities have produced the highest returns since 2009, however, they also had the highest volatility. Global equities suffered declines in three out of eleven years.
One characteristic of the holy grail portfolio is no money-losing years. There was one investment that had positive returns for every year from 2009 to 2019. Was it the supposedly safe global bond portfolio? No, global bonds suffered three down years.
The strategy that was a consistent performer with no down years was merger arbitrage.
Not only did it have the most consistent returns, it actually had the best performance. With an annualized 4.1% return and a 2.5% standard deviation, merger arbitrage had a 1.64 Sharpe ratio, which represents a risk-adjusted return that was 2.5x higher than global equities.
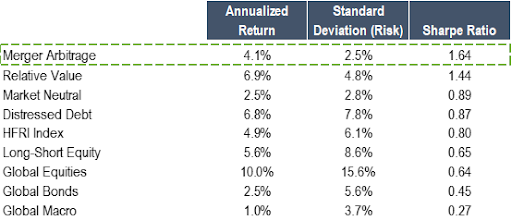
Source: Accelerate, J.P. Morgan Asset Management
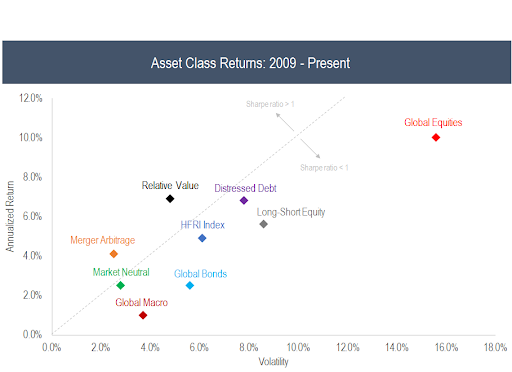
Source: Accelerate, J.P. Morgan Asset Management
While most hedge fund strategies had lower annualized returns than the MSCI ACWI, all hedge fund strategies (except global macro) outperformed both global stocks and global bonds since 2009.
Comparing apples-to-apples across hedge fund strategies, merger arbitrage comes out on top. Its 1.64 Sharpe ratio is over twice as high as the HFRI index, which represents a composite of all hedge fund strategies.
Merger Arbitrage as an Asset Class
Merger arbitrage has been around since the days of value investing legend Ben Graham’s Graham-Newman Partnership, who was practising the niche investment strategy in the 1940’s and 1950’s.
The strategy didn’t begin to generate significant interest among investors until the merger mania of the 1980’s. Back then it was the wild west and returns for merger arbitrageurs were very high. Notably, Warren Buffett earned a 53% rate of return from his merger arbitrage investments in 1988.
Over the past few decades, merger arbitrage has become institutionalized and standardized. Assets allocated to the strategy have increased almost 3-fold over the past five years to over $70 billion in funds focused on the strategy.
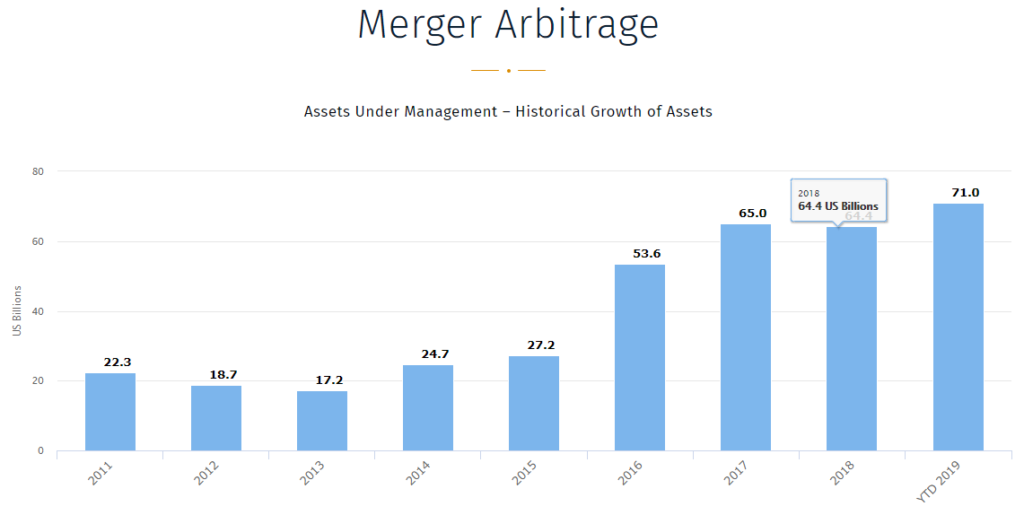
Source: BarclayHedge
Active vs Passive
Long-only mutual funds have had notoriously poor relative performance over the short and long-term as compared to the passive benchmark. The vast majority of active long-only mutual funds have underperformed their benchmark.
In contrast to long-only equities, merger arbitrage is an asset class in which most active arbitrageurs beat the passive benchmark.
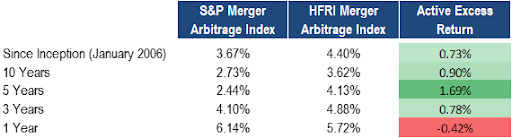
Source: Hedge Fund Research, S&P, Bloomberg
Active management pays off in arbitrage, as seen with the medium and long-term outperformance of active merger arbitrage strategies, as represented by the HFRI Merger Arbitrage Index, compared to the passive benchmark, the S&P Merger Arbitrage Index.
A Superior Form of Fixed Income Investing
Investors love fixed income given the stability and reliability of the asset class. Their bond portfolios generate interest payments that combine to form a steady yield.
Zero coupon bonds are bought at a discount and redeemed at par upon maturity (if they don’t default). The discount to par is where the yield generation comes from.
Merger arbitrage investments can be viewed from the same perspective as a zero coupon bond. In a merger arb trade, a security is bought at a discount to the deal consideration, and yield is generated once the deal closes and the arbitrageur gets paid (assuming the deal doesn’t break).
Both bonds and merger arbitrage investments produce yield for an investor in a similar manner.
The current merger arbitrage universe has an average yield of 5.9%, which compares favourably to the current BBB bond index yield of 3.2%.
On an after-tax basis, the yield from merger arbitrage looks even better on a comparative basis. The reason being is yield from merger arbitrage largely comes in the form of capital gains, versus interest income from fixed income. Generally speaking, capital gains are taxed at half the rate of interest income.
Merger Arbitrage – Earning its Way into Investor Portfolios
The holy grail investment strategy may be unrealistic, however, given its steady and consistent returns with low volatility, merger arbitrage may be the closest thing we have to it.
In addition to its exceptional performance, exceeding that of global stocks by 2.5x since 2009, its stability in providing investors with tax-efficient yield should make merger arbitrage a default allocation in all investor portfolios.
-Julian

