


June 14, 2026 – For thousands of years, people engaging in commerce and investing have understood that an ownership interest in an enterprise is more valuable the more profit it produces.
Early financial accounting can be traced back to ancient Mesopotamia, where Luca Pacioli invented double-entry bookkeeping and thereby formalized profit and loss in 1494.
As capitalism’s influence grew in the 1700s and 1800s, enterprising investors evaluated shares in businesses using dividends and asset values.
Modern-day earnings-based stock analysis became much more popular in the early 20th century. Industry leaders such as Benjamin Graham developed fundamental investing through security analysis, which involved estimating a stock’s intrinsic value through the analysis and consideration of its cash flows, earnings power, asset value, balance-sheet strength, and dividends.
Stock bubbles, representing economic cycles where the prices of shares skyrocket far beyond their fundamental value, have existed for ages. The first documented stock bubble was the South Sea Bubble of 1720 in Britain.
The South Sea Company was a joint-stock company whose shares soared on exaggerated expectations of profit from global trade, a frontier business at the time with tremendous growth potential. The speculative rise and subsequent crash of its stock created the classic stock bubble dynamic that continues to this day.
One formative historical stock bubble that affects modern-day investors is the meme stock bubble of 2021, a retail-investor-driven speculative frenzy in which a contingent of heavily-shorted, socially viral stocks, including GameStop and AMC, saw their share prices soar.
The meme stock bubble was unique because it did not share the same characteristics of a classic bubble, in which soaring stock prices are based on hopes of future business success through significant revenue and profit growth.
In fact, the meme stock bubble was based on the opposite. The army of retail speculators behind the meme stock bubble targeted businesses with some of the worst underlying fundamentals such as video game retailers and movie theaters, solely because professional investors had shorted their stocks based on their declining fundamental business prospects.
As expected, meme stocks eventually crashed, and most of the speculators behind the movement lost money.
Nevertheless, despite the predictable path of bubbles and cycles of wild speculative activity, they keep occurring. One of the main reasons that markets are cyclical is that the oldest, most experienced capital allocators are aged out of the market each year and are replaced by fresh-faced, unsophisticated traders who have not yet learned the lessons of market history.
As they say, what’s old is new again. While many from the meme stock bubble of 2021 came and went, they have seemingly been replaced by a new crop of speculators.
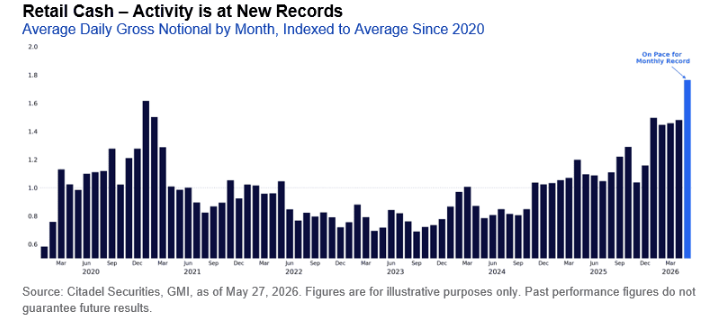
While retail stock trading declined precipitously after peaking at the apex of the meme stock bubble in early 2021, it has returned with a vengeance. The retail army that powers a significant portion of public equity volume, estimated to be as much as 20% to 25% of U.S. equity trading volume, has returned bigger than ever. Last month, retail investor stock volume exceeded the 2021 peak by more than 10%.
With elevated retail investor participation in the stock market, increased speculative activity has been a logical result. For example, the market’s most shorted stocks, which typically represent a basket of the stocks with the worst fundamentals and business prospects, have soared. The Goldman Sachs Most Shorted stock basket, which rallied by 327% until its peak in 2021 and subsequently crashed by -67%, has surged 137% since last spring.
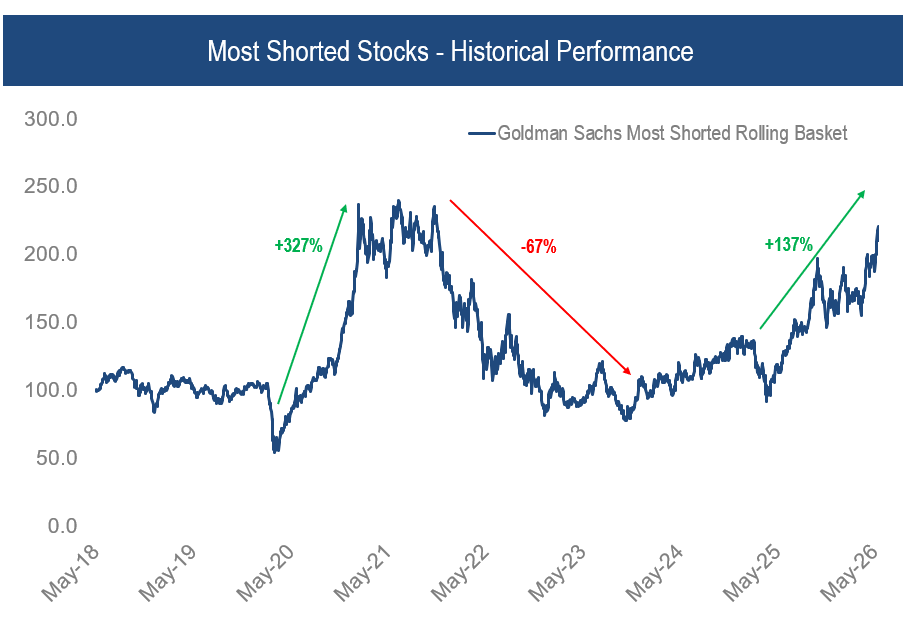
Source: Accelerate, Bloomberg
In addition, another potential sign of excessive speculative activity is the outperformance of the securities of unprofitable businesses. For example, the Goldman Sachs Non-Profitable Tech basket, which skyrocketed by 415% and then crashed by -77% during the meme stock frenzy, has made a historic resurgence. Since last spring, unprofitable stocks have surged by 226%.
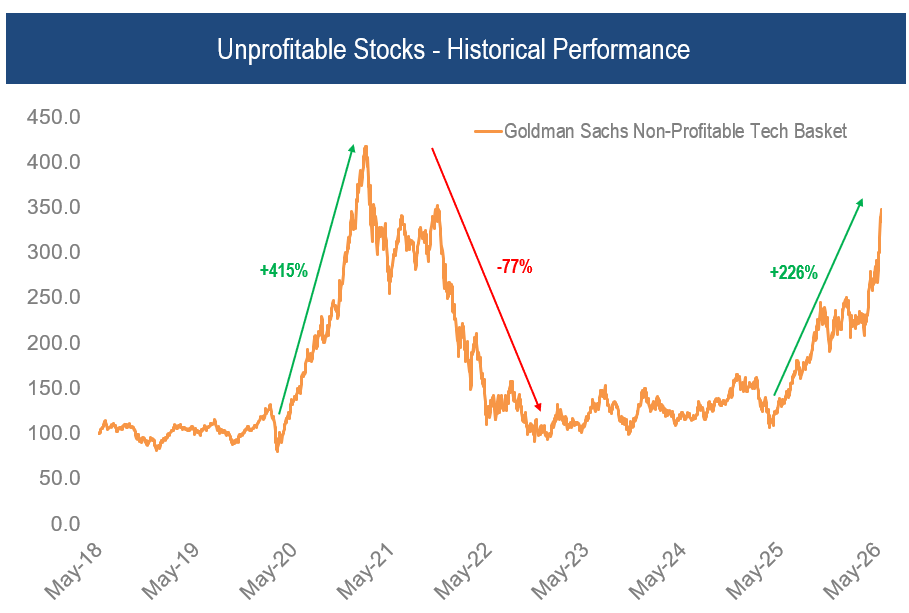
Source: Accelerate, Bloomberg
Markets evolve, but human nature does not. With the recent resurgence of retail investor influence in the stock market, speculative securities have outperformed markedly.
Clearly, this dynamic presents unique challenges for short-sellers and long-short equity investors, who typically bet against stocks with poor fundamentals.
That said, as history has shown, these speculative booms are typically ephemeral, and the bust is seemingly only a matter of time. One dynamic working in favour of those betting against the boom in speculative securities, or alternatively, those long-only investors who choose not to participate, is that one main catalyst always emerges that ends the bubble: supply and demand.
As rabid demand for speculative securities increases, companies (particularly those money-losing businesses most needing the cash) rush to issue more stock. Typically, a flood of stock supply eventually overwhelms the demand, causing share prices to fall. As share price momentum reverses and buyers are inundated with more supply, this fall can turn into a crash, especially since the companies of interest generally do not have the underlying business performance for fundamentally-driven investors to step in and provide a floor for the stocks.
We are beginning to see this expected increase in stock supply play out. The number of unprofitable companies issuing stock through at-the-market equity programs has risen. Moreover, huge initial public offerings are coming to market, adding trillions of dollars of additional stock to the supply.
SpaceX’s recent IPO on Friday was the largest of all-time, raising $75 billion at a valuation of $1.75 trillion. Its first day jump, in which more than $80 billion worth of stock traded, took the company’s market cap above $2 trillion. Retail participation was up to 30% of the IPO (about 5x their typical level), equal to about $22.5 billion. SpaceX’s increased stock supply effect was felt immediately by speculators – a basket of low-quality, “junk” space stocks had the wind taken out of their sails and saw their stock prices crash by double-digits the day of the industry leaders’ IPO, as they were sold to generate the cash needed to buy SpaceX (whose market cap dwarfs all meme stocks combined).
Additional blockbuster IPOs, including OpenAI and Anthropic, are expected to bring trillions of dollars of equity supply to the public markets. The liquidity needed for the retail army of investors to participate in these stocks will be significant, and must come from somewhere. Look for the share prices of heavily-shorted, profitless businesses to come under pressure as they are sold to fund the stock buys of the IPOs of AI and space leaders.
Accelerate manages five alternative investment solutions, each with a specific mandate:
- Accelerate Arbitrage Fund (TSX: ARB): Merger Arbitrage
- Accelerate Absolute Return Fund (TSX: HDGE): Absolute Return
- Accelerate OneChoice Alternative Multi-Asset Fund (TSX: ONEC): Multi-Asset
- Accelerate Canadian Long Short Equity Fund (TSX: ATSX): Long Short Equity
- Accelerate Diversified Credit Income Fund (TSX: INCM): Private Credit
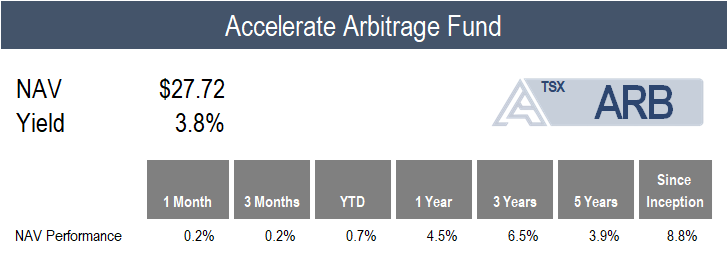
ARB gained 0.2% in May compared to the benchmark S&P Merger Arbitrage Total Return Index’s 0.5% gain.
The Fund added two merger arbitrage investments during the month (one U.S., one Canadian) and participated in nine SPAC IPOs.
Currently, ARB is 161.1% long and -3.8% short (164.9% gross exposure), with 74% allocated to SPAC arbitrage and 26% to merger arbitrage (with 11% in LBOs and 15% in strategic M&A).
![]()

HDGE declined by -4.2% in May, which was the most challenging environment for short selling and hedging in several years. For reference, the Goldman Sachs Most Shorted basket gained 14.7% for the month.
Every major long-short factor pair posted a negative return in May, with several experiencing double-digit drawdowns as short portfolios surged (particularly in retail-favoured sectors such as space, quantum, and AI). The lowest quality and most overvalued stocks outperformed significantly, while high-quality and undervalued securities remained nearly flat on the month. Notably, undervalued stocks in the U.S. underperformed overvalued names by -16.0% while high-quality stocks underperformed low-quality companies by -11.1%.
Top Fund contributors include long positions in Dell Technologies and Micron Technology, along with a short position in Portillos. Top Fund detractors include short positions in Voyager Technologies, D-Wave Quantum, and Rapid7.
![]()

ONEC declined by -0.6% in a mixed month for alternative asset classes.
Positive contributors include the Fund’s allocations to managed futures, long short equity, risk parity, leveraged loans, and merger arbitrage, which gained 1.4%, 1.4%, 1.0%, 0.6%, and 0.2%, respectively.
Negative contributors include real estate, commodities, gold, infrastructure, absolute return, and private credit, which experienced a monthly decline of -0.3%, -0.8%, -1.4%, -2.2%, -4.2%, and -5.5%, respectively.
![]()
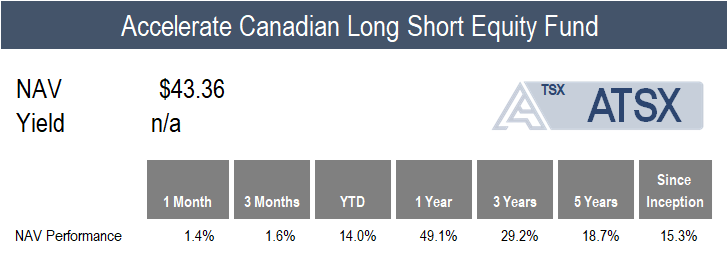
ATSX increased by 1.4% last month, trailing the benchmark S&P/TSX 60 Index’s 2.1% return.
The Fund’s short portfolios were a drag on performance in May. Specifically, most Canadian long-short factor portfolios experienced a drawdown, particularly the value, quality and price momentum portfolios.
Top Fund contributors include long positions in Quebecor and Wesdome Gold Mines, along with a short position in Element Fleet Management. Top Fund detractors include short positions in MDA Space, First Quantum Minerals, and Canfor.
![]()
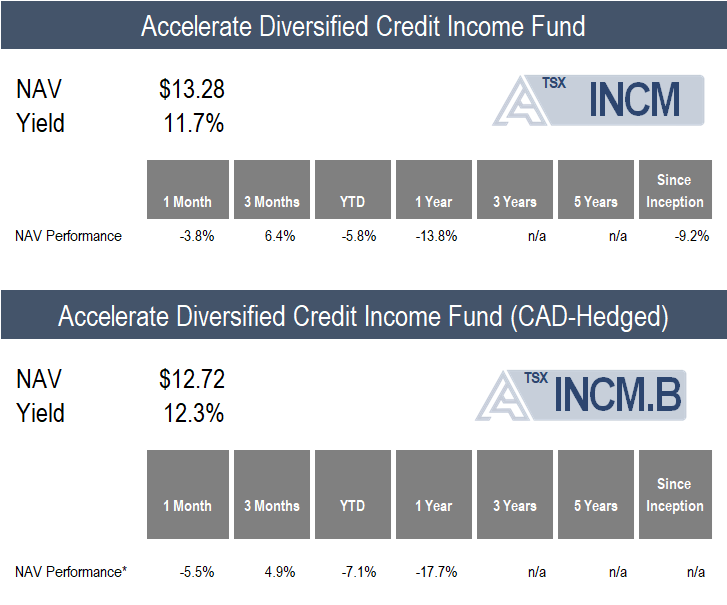
INCM declined by -3.8% in May (-5.5% on a CAD-hedged basis), primarily driven by mark-to-market NAV declines combined with spread-widening.
The BDCs held in the fund disclosed their first quarter results in May, as detailed in our latest quarterly private credit report, Marking To Market.
Currently, INCM is allocated to 20 private credit portfolios (through listed BDCs), totalling more than 5,000 loans and investments, of which 86.9% are senior secured and 92.7% are floating rate. The current yield on the INCM portfolio is 12.0%, and it trades at a -21.5% discount to its net asset value. INCM’s exposure to software loans is 16.8% of its portfolio.
![]()
Have questions about Accelerate’s investment strategies? Click below to book a call with me:

-Julian
Disclaimer: This distribution does not constitute investment, legal or tax advice. Data provided in this distribution should not be viewed as a recommendation or solicitation of an offer to buy or sell any securities or investment strategies. Please read the relevant prospectus before investing. For a summary of the risks of an investment in the Accelerate ETFs, please see the specific risks set out in the prospectus. ETFs are not guaranteed and the information in this distribution is based on current market conditions and may fluctuate and change in the future. Past performance is not indicative of future results. Decisions regarding tax, investments, and all other financial matters should be made solely with the guidance of a qualified professional. Visit www.AccelerateShares.com for more information.

