


May 30, 2026 – Marking an investment to market involves valuing the asset based on its current market price, rather than its historical cost or what the asset owner thinks it “should” be worth.
For example, if a fund bought a bond for $100 and comparable bonds now trade at $92, marking to market means the fund records the bond at $92. The unrealized loss is recognized in the financial statements, even if the bond has not been sold. Simple enough, however, not without some controversy – particularly when it comes to less liquid assets.
Marking to market is important because it provides stakeholders with a realistic, up-to-date view of what an asset can be sold for at a given point in time. Without mark-to-market accounting, portfolios can appear more stable than they really are, because losses may remain hidden until an asset is sold or defaults.
In liquid markets such as U.S. equities, marking to market is straightforward. Typically, one uses the last traded price on a given date. Alternatively, one could use the last bid in the market as of market close, or the average of the last bid and ask prices. Liquid securities such as stocks are classified as Level 1 assets, which are the easiest to mark because they have a live, transparent, and up-to-date market price that is readily available and verifiable. For example, Apple’s stock last traded at $312.06, which is the best indicator of the shares’ fair value.
Level 2 assets do not have a direct quoted price for the exact instrument, but they can be valued using observable market inputs. Examples of Level 2 assets include corporate bonds, leveraged loans, and less frequently traded fixed income securities. The valuation of these assets may rely on comparable securities, yield curves, credit spreads, broker quotes, or pricing services. The values of these assets are still tied to market data, but more judgment is involved than with Level 1 assets.
Level 3 assets are the hardest to value because they rely heavily on unobservable inputs. Private credit loans are an example of Level 3 assets. Valuations may depend on internal models, discounted cash flow assumptions, EBITDA multiples, recovery estimates, default probabilities, appraisals, or manager judgment. These valuations can be reasonable, but they are less independently verifiable and more vulnerable to smoothing, lagging, or optimistic assumptions.
The hierarchy is important because it indicates how much confidence investors should have in the reported fair value. A portfolio full of Level 1 assets, such as an equity ETF, is generally more transparent and easier to liquidate. A portfolio with a large Level 3 allocation may still be high quality, but the reported net asset value (“NAV”) requires more trust in the manager’s valuation process or greater due diligence.
Accordingly, marking-to-market on a quarterly basis forces asset owners to regularly confront changing market conditions, including higher interest rates, wider credit spreads, lower comparable valuations, or weaker borrower performance. It helps prevent “extend and pretend,” a scenario in which assets are carried at stale values even though market or borrower conditions have deteriorated.
For investment funds, a mark-to-market valuation is central to calculating an accurate net asset value. In contrast to a common misconception, private credit funds, including Business Development Companies (“BDCs”), mark their assets to market quarterly. Obviously, for Level 3 assets without a live market price, this quarterly valuation of private credit loans is highly subjective.
With that, one comparable liquid market price that private credit managers turn to in order to help derive relevant market conditions for accurately marking their book is the leveraged loan market (also known as the broadly syndicated loan market).
The leveraged loan and private credit markets are similar because both primarily finance below-investment-grade, sponsor-backed companies through floating-rate senior secured loans. In both markets, returns are driven by credit spreads, base rates, leverage levels, documentation, default risk, recovery values, and borrower fundamentals.
The key difference between the two market segments is liquidity and price discovery. Leveraged loans are broadly distributed and trade more actively, so market prices adjust quickly when credit spreads widen, rates move, or risk appetite changes. Private credit loans are closely held (often with just one lender) and rarely trade, so valuations are more model-based.
However, private credit is not immune to public market signals. Managers often mark their books in sympathy with leveraged loan prices, especially when comparable public loans or indices show meaningful spread widening or price declines. Even if a private credit loan has not traded (which is almost always the case), a weaker leveraged loan market generally implies a lower fair value for a private credit loan of similar credit risk.
Therefore, if the leveraged loan market trades down, private credit portfolios should be marked-down in sympathy.
Accordingly, as the Morningstar LSTA Leveraged Loan Index experienced a -2.1% price decline (-0.6% total return) in the first quarter, BDCs marked down their private credit loan portfolios.
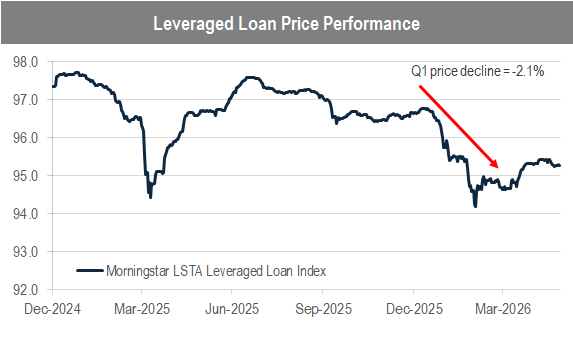
Source: Bloomberg, Accelerate
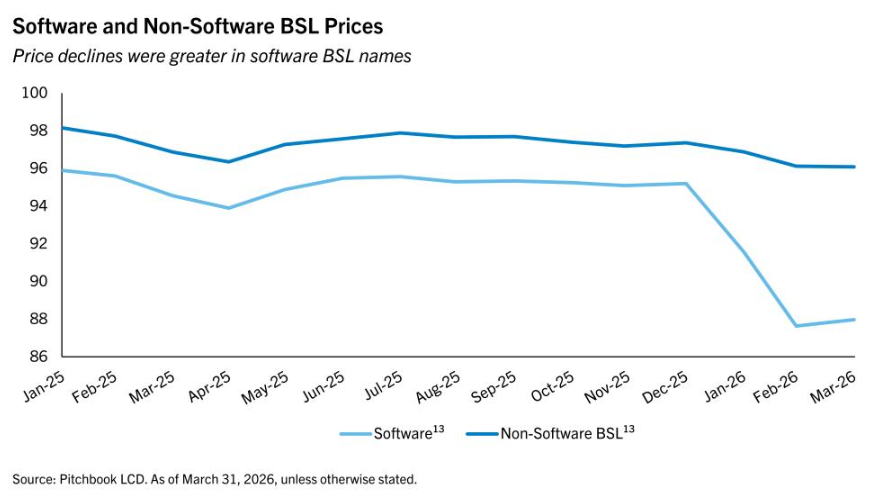
There is one major nuance regarding recent leveraged loan performance. In the first quarter, amid fears of AI disruption, software loans experienced greater weakness than the market, falling approximately -8%.
Q1 Private Credit Performance
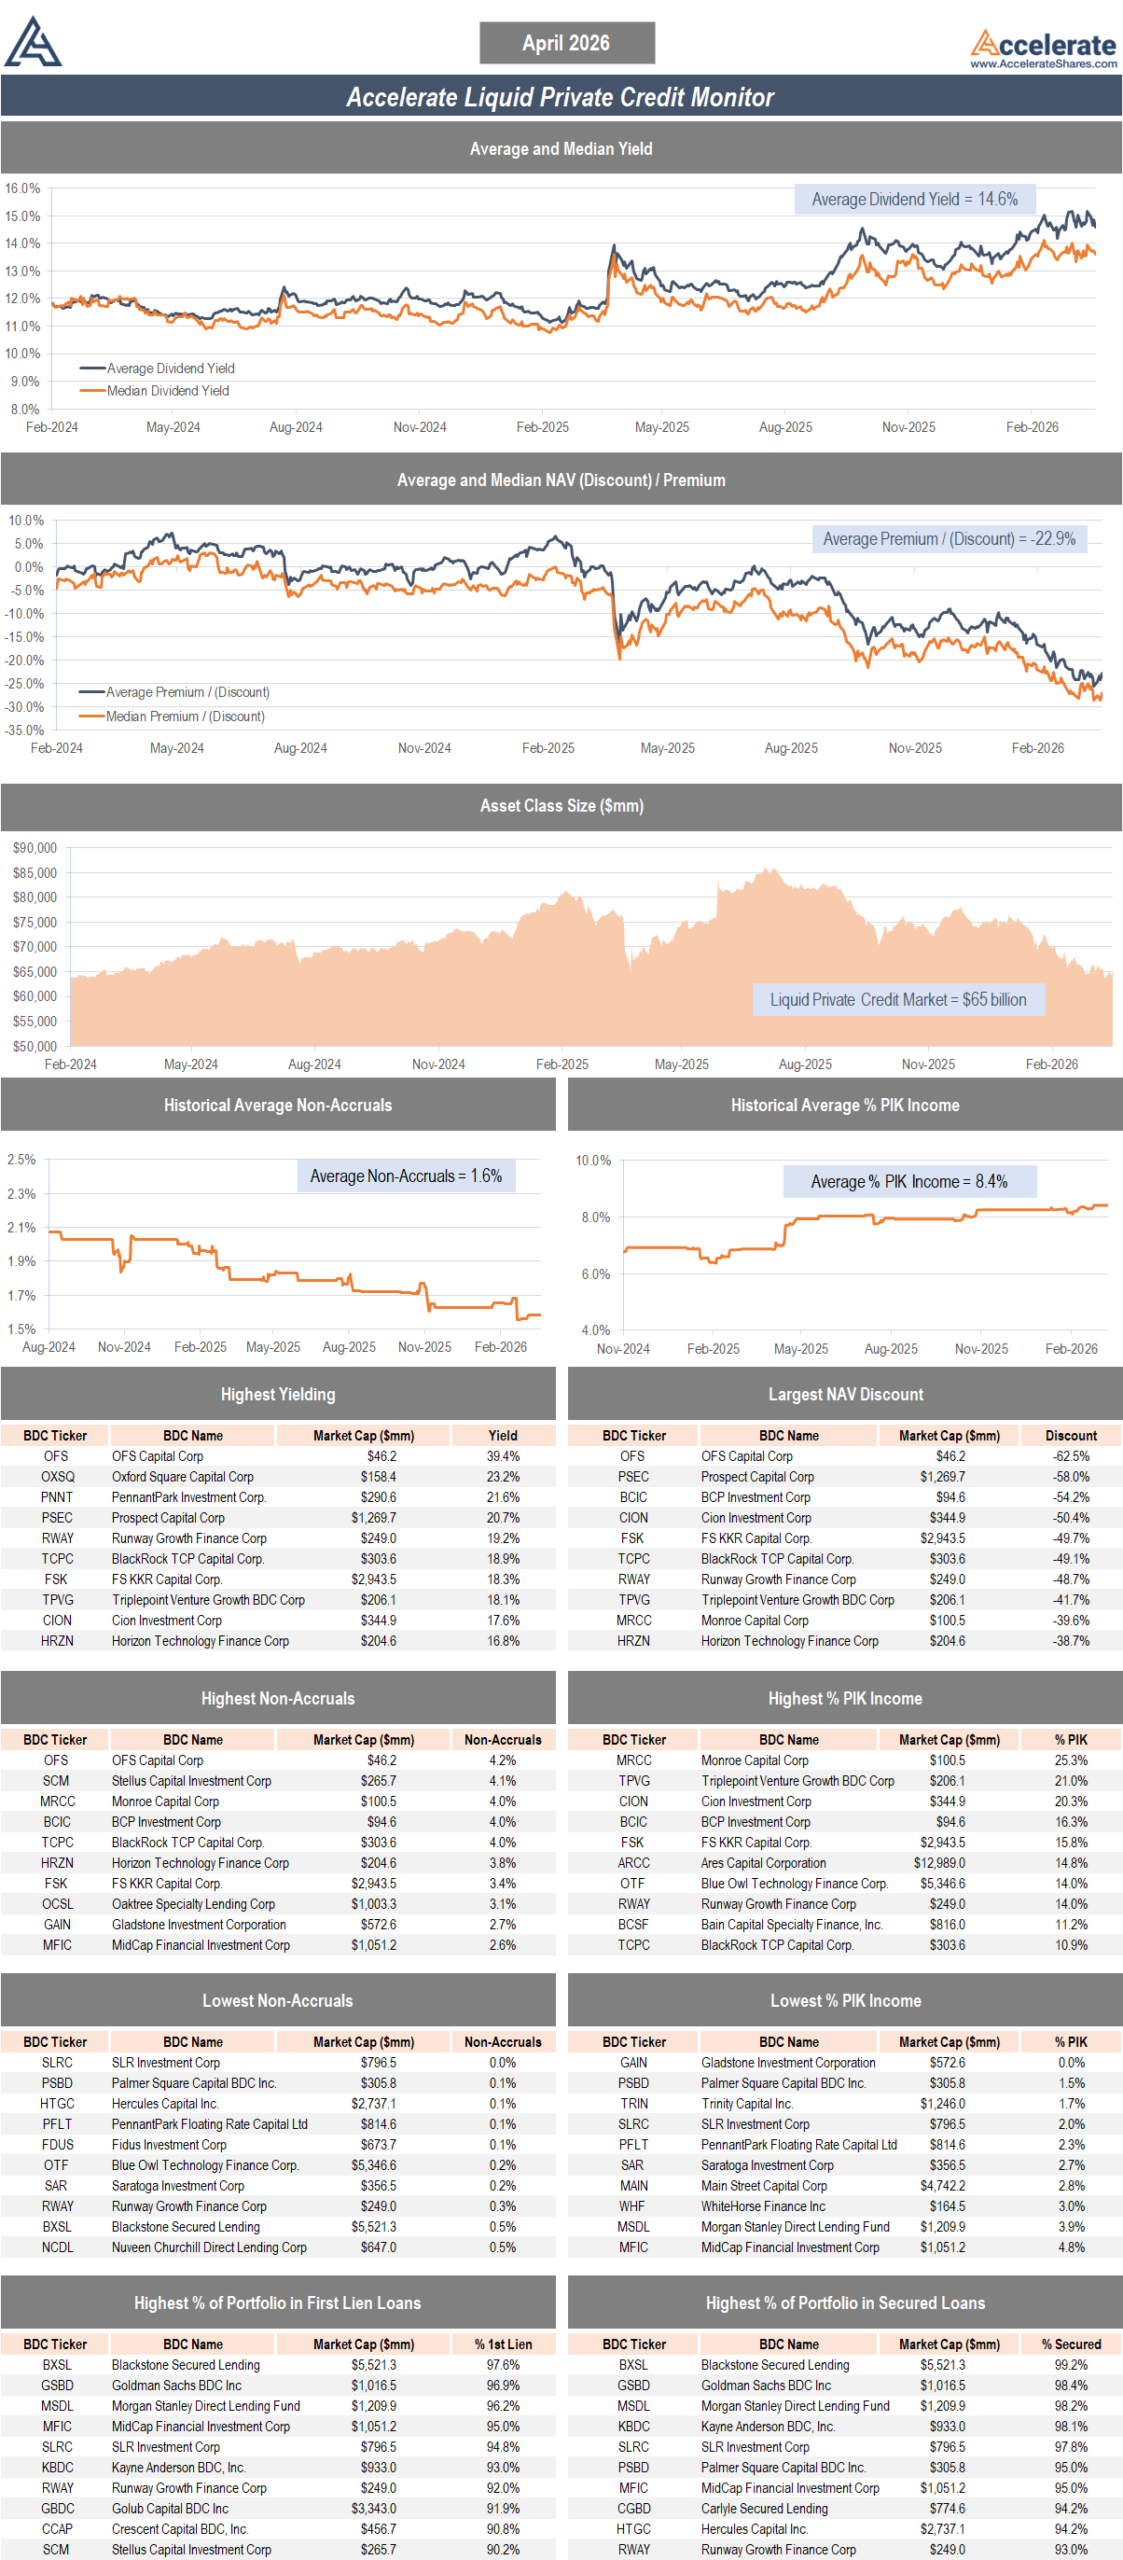
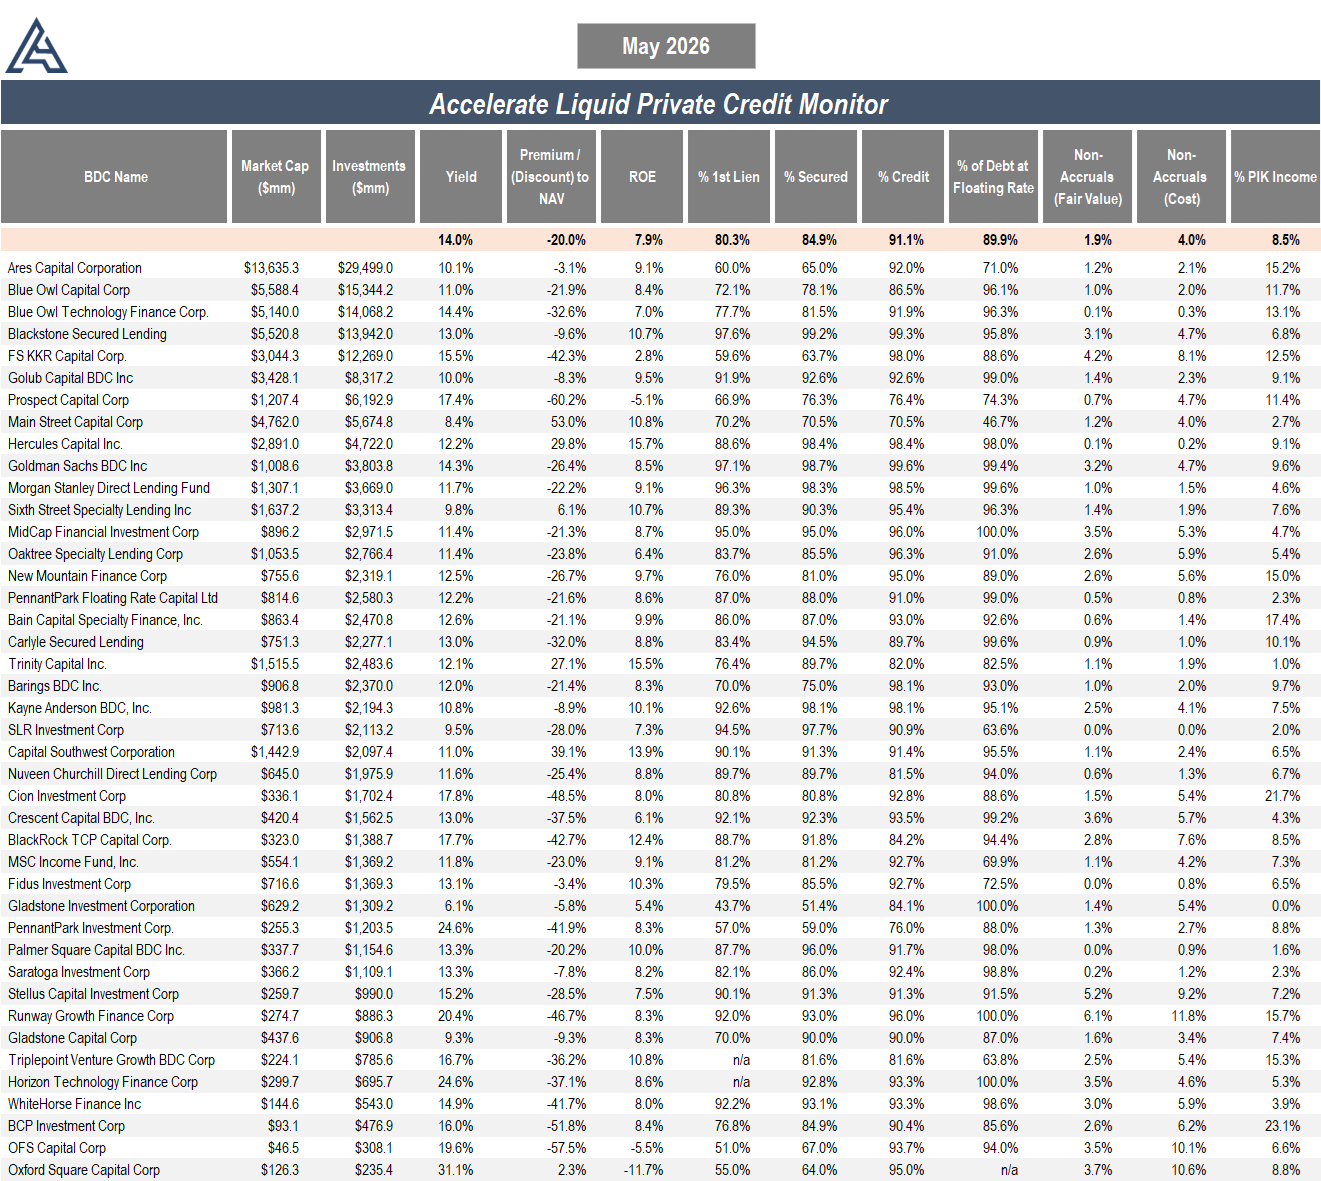
First quarter performance of private credit, through the lens of publicly-traded BDCs, was subpar. The first quarter was less a “credit break” than a repricing quarter. Across the public BDC cohort, the dominant message was that current income remains resilient and credit conditions remain relatively benign, however, the market is becoming far less forgiving of weaker borrowers, higher leverage, and software exposure. The best private credit platforms showed strong dividend coverage, senior-secured portfolios, and manageable non-accruals. In contrast, the weaker or more idiosyncratically exposed loan books showed NAV pressure, rising non-accruals, and sponsor-led rescue or restructuring activity.
BDC portfolio yields remained high by historical standards, generally clustered around the high-9% to low-10% area for many first-lien-heavy portfolios.
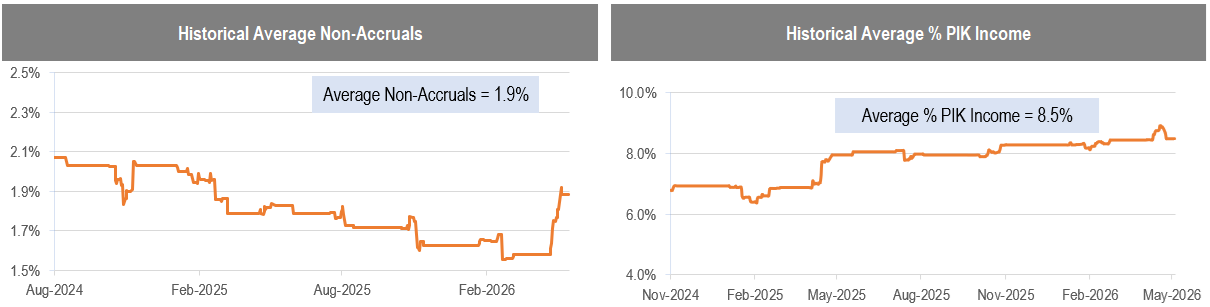
Q1 did not show a uniform decline in credit conditions. It showed segmentation. Some portfolios retained low non-accrual rates and stable borrower performance, while others showed deterioration. The net result was a 30bps increase in non-accruals to 1.9% (based on fair value), while payment-in-kind (“PIK”) income remained stable quarter-over-quarter at 8.5%.
The direct lending market is seeing some stress from older vintages, sponsor-owned software, highly levered borrowers, and companies that were underwritten with more aggressive growth expectations. One of the largest private credit defaults this year was Medallia, a 2021-vintage private equity software buyout known as an “ARR loan” (which is loan to a subscription software business whose creditworthiness is primarily underwritten against annual recurring revenue, rather than EBITDA or hard assets). Although the $6.4 billion Thoma Bravo-led buyout featured a low loan-to-value, Medallia did not grow as quickly as expected after the buyout and was ultimately unable to support its debt load. The Medallia lenders, which include BDCs from Blackstone and KKR, took ownership of the company and marked down its loans to 60 cents on the dollar. The private equity sponsor lost its entire $5.1 billion equity investment (private equity is risky!).
Ultimately, Medallia was a 2021-vintage ARR loan underwritten to high-growth SaaS assumptions, but growth disappointed, leverage was too high, rates and cash interest rose, software valuations compressed, and the sponsor chose not to keep funding the hole. It was not an AI disruption story. The result was a debt-for-equity restructuring where lenders took the keys.
Even so, Q1 saw broad NAV pressure across BDCs, primarily driven by unrealized depreciation (mark-to-market declines), rather than realized credit losses. This unrealized depreciation was accounted for in sympathy with the leveraged loan market drawdown. For example, Golub Capital BDC (GBDC), one of the largest and oldest listed BDCs, recorded its second largest NAV loss in Q1 in its history (its second largest mark-to-market decline after Q1 2020). Spread widening in the leveraged loan market led to unrealized depreciation in private credit loan books through fair value adjustments, not permanent impairment of capital, even though overall credit performance of the portfolio remained solid. Ergo, as spreads normalize and loans are repaid at par, these unrealized losses are expected to reverse (similar to what happened at GBDC after Q1 2020 as seen below, when the BDC recouped much of the previously booked mark-to-market losses).
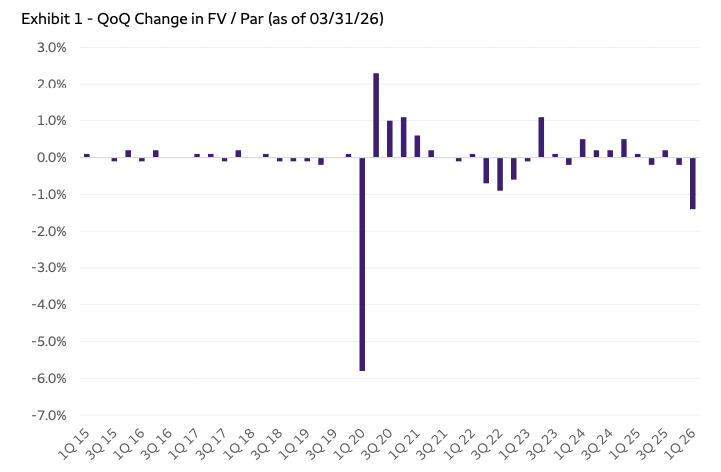
Source: Wells Fargo
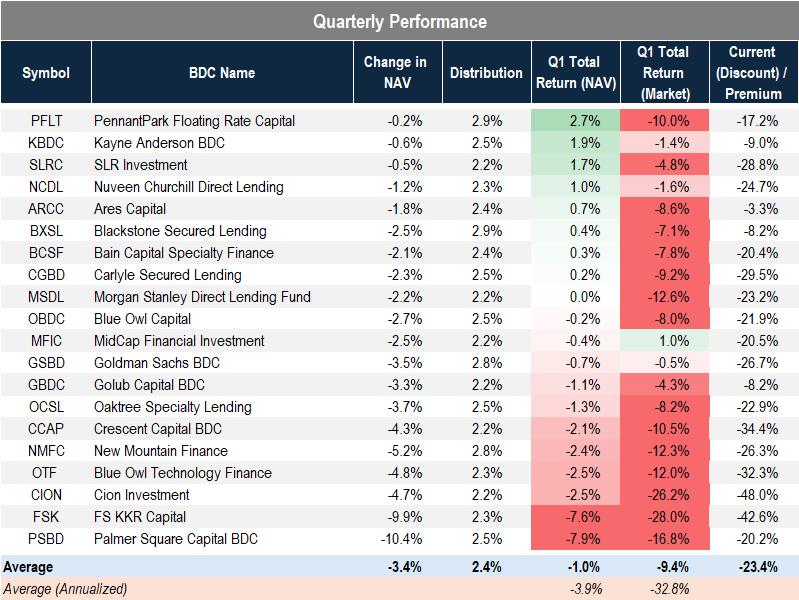
Nonetheless, as a result of declining loan marks amid widening spreads, the average BDC NAV declined by -3.4% in the first quarter, compared to the leveraged loan market’s -2.1% fall. Inclusive of distributions of 2.4%, the average BDC generated a total return of -1.0% in Q1, compared to the leveraged loan market’s -0.6% total return.
In contrast to the average BDC’s -1.0% total return based on fundamental NAV performance, their market performance was far uglier, resulting in a -9.4% market total return, driven by widening NAV discounts due to widespread price declines. Consequently, the average BDC now trades at a NAV discount of more than -20%.
Source: Accelerate, Bloomberg
As at the end of the first quarter, the BDC cohort marked its portfolio at roughly 96.3% of cost on average.
In addition to mark-to-market dynamics, credit events, non-accruals and PIK, there are additional puts and takes in the current market environment. On a positive note, two macro tailwinds have emerged for credit investors.
First, given the negative sentiment and capital outflows from the asset class, primarily in the non-traded BDC space (as we wrote about in last quarter’s private credit monitor, Redemptions Are Climbing – Is That a Problem?), direct lending spreads are widening. Anecdotally, private credit managers have indicated that newly originated direct loans feature spreads approximately 50bps wider than last quarter, while leverage levels have declined by around 0.5x.
Second, the outlook for base rates has completely reversed. At the start of the year, the market was pricing in two rate cuts. Now, given the recent spike in inflation, the market is pricing in one to two rate hikes.
These two dynamics – widening spreads and rising base rates – support higher future portfolio yields for private credit.
Another positive aspect is the recent increase in share repurchases by public BDC managers. Many are capitalizing on widespread NAV discounts (and high portfolio yields) to repurchase their shares far below book value instead of originating new loans. Share repurchases at a significant discount to book value are highly accretive to NAV per share. Two standouts running this buyback playbook include New Mountain Finance and MidCap Financial Investment, which reduced their shares outstanding by -6.9% and -7.7% last quarter, respectively (and by -11.4% and -8.8% over the past year).
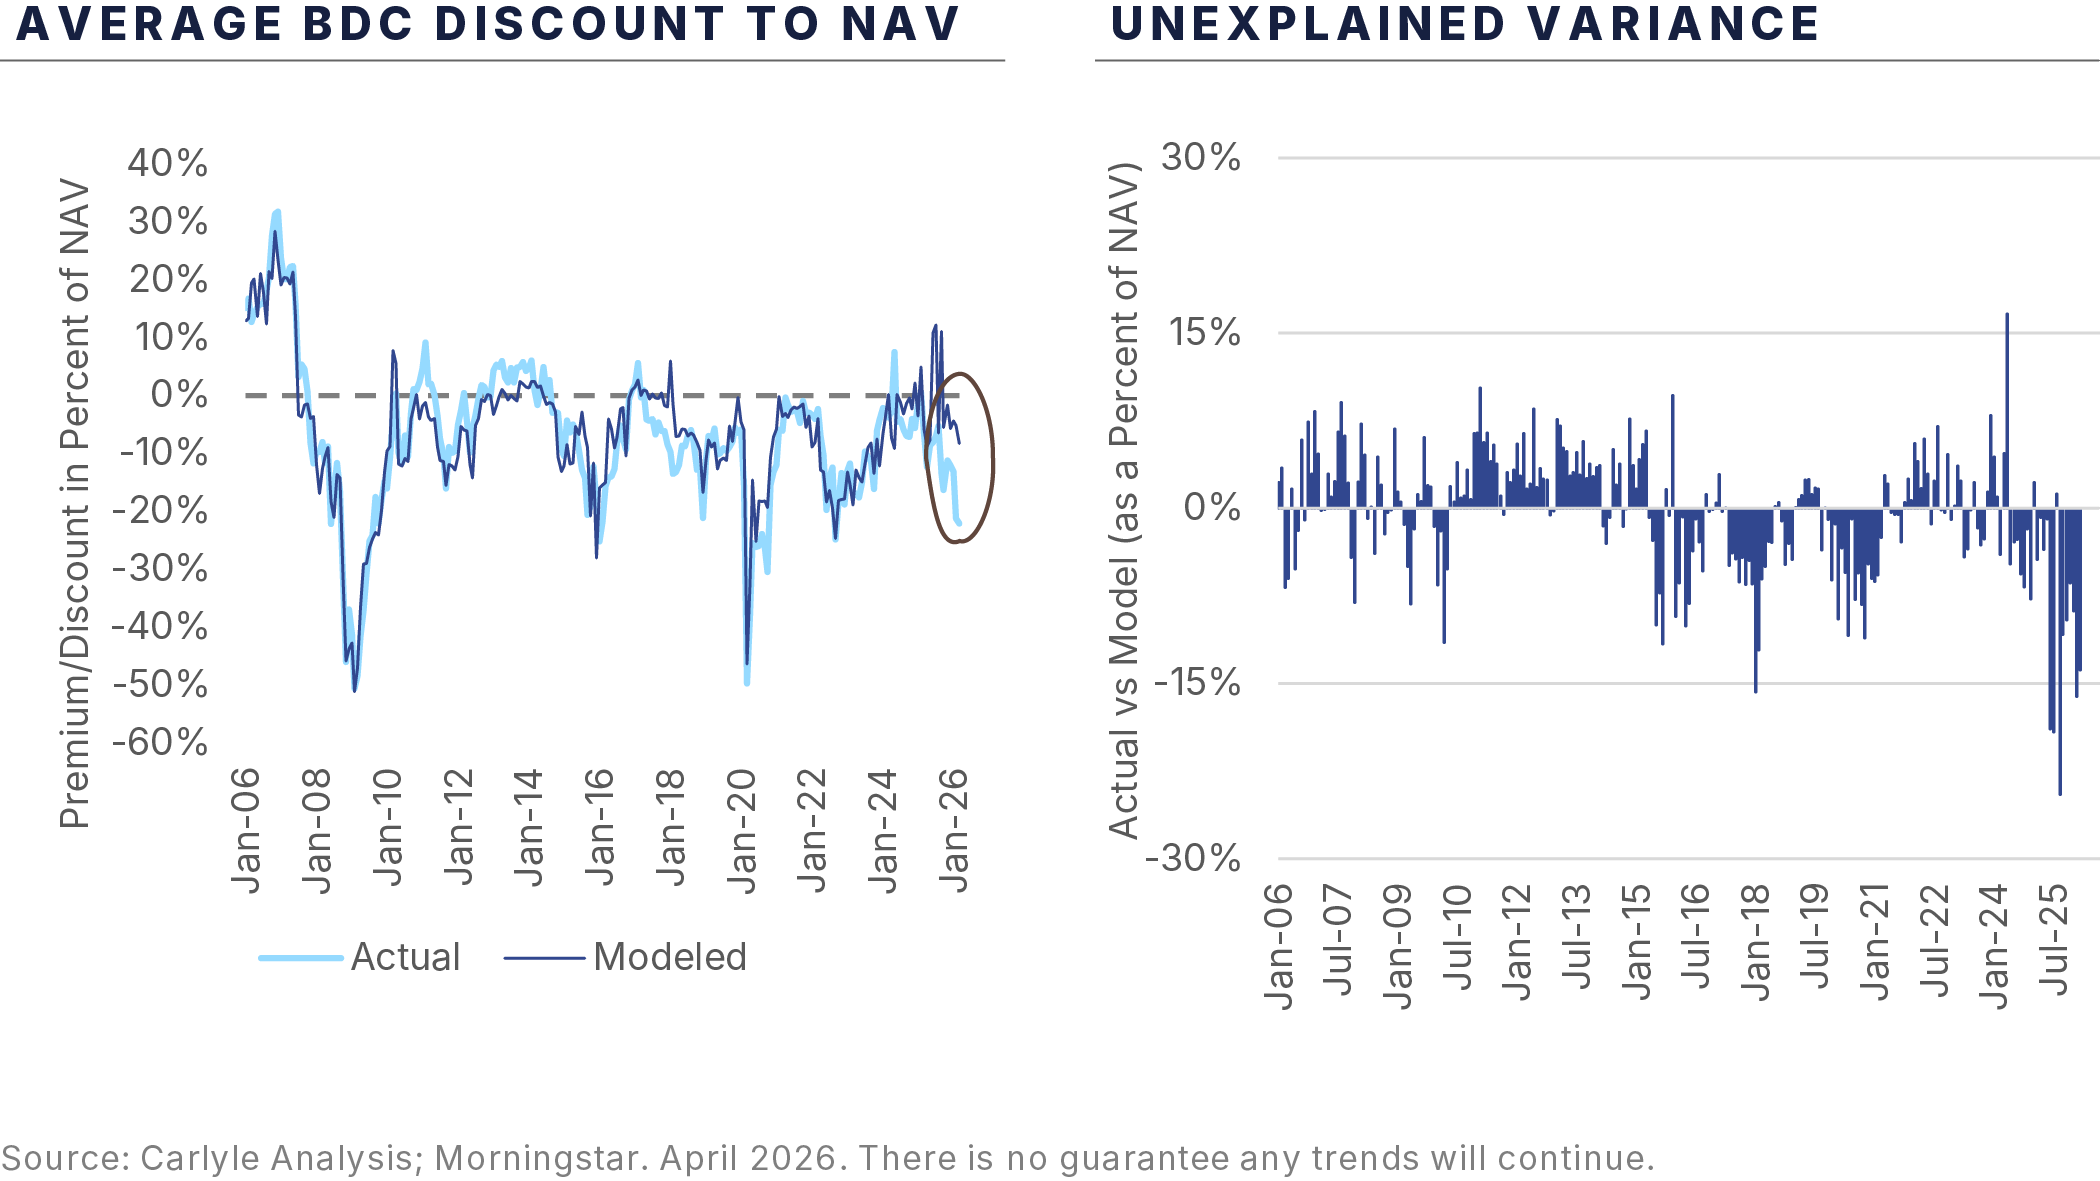
The cleanest read-through is that Q1 was a marking-pressure quarter, not just a non-accrual quarter. Several BDCs showed lower NAVs and unrealized depreciation even where cash income remained resilient. Despite the “not disastrous” underlying fundamental credit conditions, extreme NAV discounts persist. Carlyle modelled estimated implied average BDC NAV discounts of approximately -5% based on current credit conditions, in contrast to the average actual BDC NAV discount of more than -20%, leading to a record “unexplained variance” in which NAV discounts are far wider than fundamentals support:
Coming into first quarter results, the mood around private credit was gloomy, with expectations low and NAV discounts at their widest since early 2020. While NAV markdowns and negative total returns are disappointing, if the leveraged loan market keeps bouncing back, BDC portfolios could be in for a reversal of some of the unrealized losses recorded in Q1 as loan prices recover. Nevertheless, with several puts and takes in the quarter, the persistent spread tightening that occurred over the past two years, driven by relentless inflows into non-traded BDCs, appears to have run its course. Now, the market is setting up for wider spreads and higher base rates, both of which are additive to future private credit portfolio yields.
The Accelerate Liquid Private Credit Monitor is utilized in running the Accelerate Diversified Credit Income Fund (TSX:INCM, INCM.B, INCM.U), which may have positions in some of the securities mentioned.
Each individual merger is assigned a risk rating:
- AA – a merger arbitrage rated ‘AA’ has the highest rating assigned by AlphaRank. The merger has the highest probability of closing.
- A – a merger arbitrage rated ‘A’ differs from the highest-rated mergers only by a small degree. The merger has a very high probability of closing.
- BBB – a merger arbitrage rated ‘BBB’ is of investment grade and has a high probability of closing.
- BB – a merger arbitrage rated ‘BB’ is somewhat speculative in nature and has a greater than 90% probability of closing.
- B – a merger arbitrage rated ‘B’ is speculative in nature and has a greater than 85% probability of closing.
- CCC – a merger arbitrage rated ‘CCC’ is very speculative in nature. The merger is subject to certain conditions that may not be satisfied.
- NR – a merger-rated NR is trading either at a premium to the implied consideration or a discount to the unaffected price.
The AlphaRank merger analytics database is utilized in running the Accelerate Arbitrage Fund (TSX: ARB), which may have positions in some of the securities mentioned.


