

June 20, 2026 – The New York Knicks’ successful 2026 NBA championship campaign was notable for a couple of reasons.
First, New York had not won the title since 1973, a 53-year wait. The team finally ended one of the league’s most famous title droughts.
Second, they went on a major playoff-winning streak. The Knicks won 13 consecutive playoff games during the postseason, tying the 1999 San Antonio Spurs for the second-longest single-postseason winning streak in NBA history, trailing only the 2017 Golden State Warriors (who won 15 straight).
As the team continued to win game after game, their confidence rose, their decision making sharpened, the crowd cheered louder, and their opponent grew more frustrated.
The players felt it. The fans felt it. The Knicks had momentum. Wins begat more wins.
It was this momentum that helped carry one of basketball’s most visible but long-suffering franchises to the top.
Just as in basketball, stocks can go on similar hot streaks. In markets, a stock starts outperforming, investors notice, capital flows in, analysts revise estimates higher, short sellers cover, and the rising price itself attracts more buyers.
Moreover, a stock that has been going up often keeps going up not merely because the chart looks good, but because the underlying forces behind the move may persist. Positive price action usually reflects improving underlying fundamentals, increasing earnings revisions, positive sector tailwinds, institutional accumulation, and even delayed investor recognition. As more people accept the new story, the share price rally continues.
Twelve month share price momentum is one of the best-documented anomalies in quantitative finance. The basic finding is simple: stocks that have outperformed over roughly the past 3 to 12 months tend to keep outperforming over the next several months, while recent losers tend to keep lagging. Winners tend to keep winning, and losers tend to keep losing.
The canonical paper on share price momentum is Jegadeesh and Titman’s Returns to Buying Winners and Selling Losers, published in 1993. The authors constructed portfolios based on stocks’ past returns over 3- to 12-month lookback periods and found that buying past winners and shorting past losers generated significant positive returns over 3- to 12-month holding periods. Importantly, they found the returns were not explained by conventional systematic risk or delayed reactions to broad common factors.
In 2013, Asness, Moskowitz, and Pedersen published Value and Momentum Everywhere, which found consistent value and momentum premia across eight diverse markets and asset classes, and documented common structure in value and momentum returns across asset classes.
In practice, the most common version of momentum investing became 12-month momentum excluding the most recent month (often written as 12–1 momentum). The reason for skipping the latest month is that very short-term reversal/microstructure effects can muddy the signal. As a result, a typical institutional definition of momentum ranks stocks by their return over months t−12 through t−2, then buys the strongest names and avoids or shorts the weakest.
Accelerate updated previous quantitative momentum research out of sample, analyzing the more recent performance of the market anomaly. We grouped liquid stock portfolios into five quintiles, based on their most recent 12–1 momentum factor ranking. These momentum factor portfolios were rebalanced on a monthly basis.
In the U.S. equity market between 2006 and 2024, the top quintile momentum portfolio generated a 12.2% annualized return, outperforming the bottom quintile by 3.8% per annum. Moreover, the momentum factor continued to work well last year and year-to-date, with top-quintile over bottom-quintile outperformance of 10.8% in 2025 and 24.2% thus far in 2026.
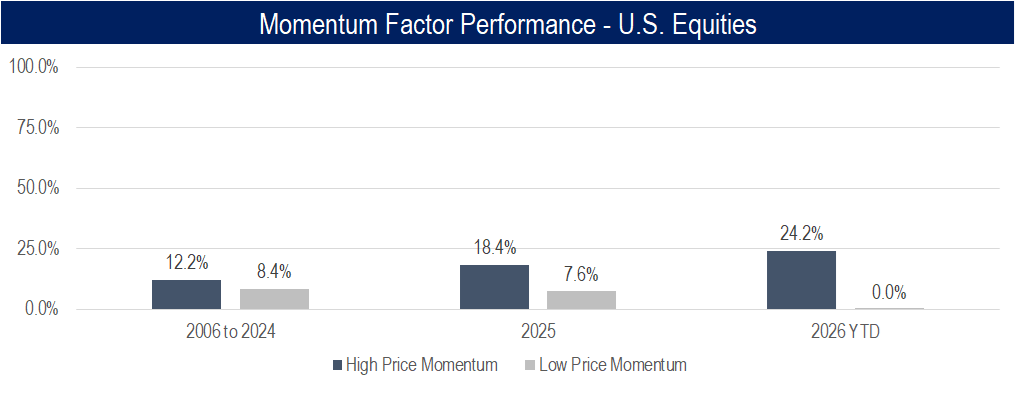
Source: Accelerate, S&P Capital IQ
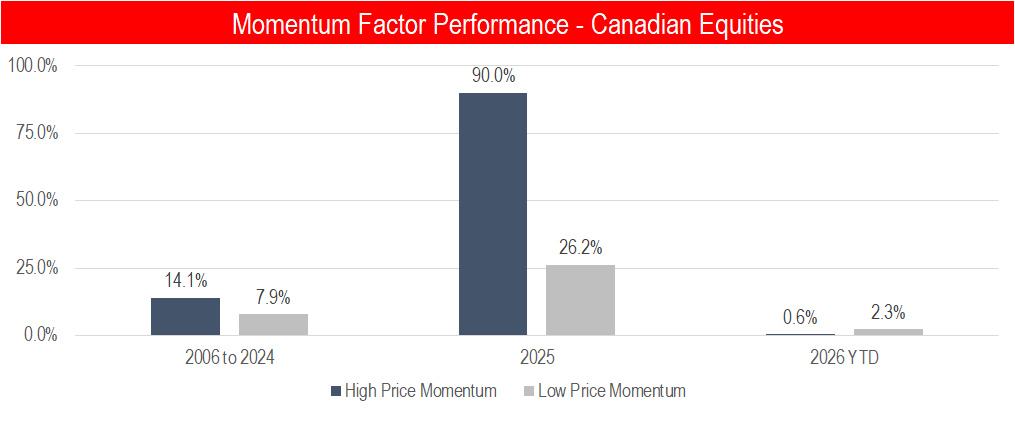
The momentum anomaly exists in other stock markets as well. For example, analyzing Canadian stocks from 2006 to 2024, the top quintile of momentum stocks generated a 14.1% annualized return, outperforming the portfolio of worst-momentum stocks by 6.2% per year. Momentum had an exceptional performance in the Canadian stock market in 2025, with the top bucket of momentum stocks rallying 90%, while the bottom portfolio returned -63.8% less at 26.2%. However, year-to-date, the factor’s performance has been muted in the Canadian market.
Source: Accelerate, S&P Capital IQ
There are a couple of explanations as to why the outperformance of the momentum factor continues to persist:
- Investor underreaction – Investors may update too slowly to new information such as earnings surprises, estimate revisions, and improving fundamentals.
- Behavioural feedback – Once a stock starts working, attention, flows, and narratives build (look no further than semiconductor stocks these days). Investors extrapolate recent strength, analysts raise price targets, underweight managers chase, and short sellers cover.
Basketball momentum turns a few made shots into a win, and several wins in a row into a hot streak. Stock momentum turns several months of outperformance into a self-reinforcing investment thesis.
Academic research has repeatedly shown that the market does not fully incorporate information instantaneously. Stocks with strong trailing 12-month performance tend to continue outperforming over intermediate horizons, suggesting that investor underreaction, slow information diffusion, and self-reinforcing capital flows can turn recent winners into future winners. Conversely, stocks with poor trailing 12-month performance tend to continue to underperform in the near term.
Accordingly, from a portfolio manager’s standpoint, the data show that momentum factor investing, particularly from a long-short perspective, can be an attractive investment strategy. In practice, momentum factor investing can work best as part of a broader multi-factor composite signal. The best use of the price momentum factor is not as a standalone “buy the top performing stocks” rule, but as a component of a broader multi-factor model that combines price momentum with earnings quality, valuation, earnings revisions, and others. To help facilitate idea generation, we highlight one top-decile stock that is forecasted to outperform and one bottom-decile stock that is predicted to underperform based on Accelerate’s multi-factor composite model in this month’s AlphaRank Top Stocks.
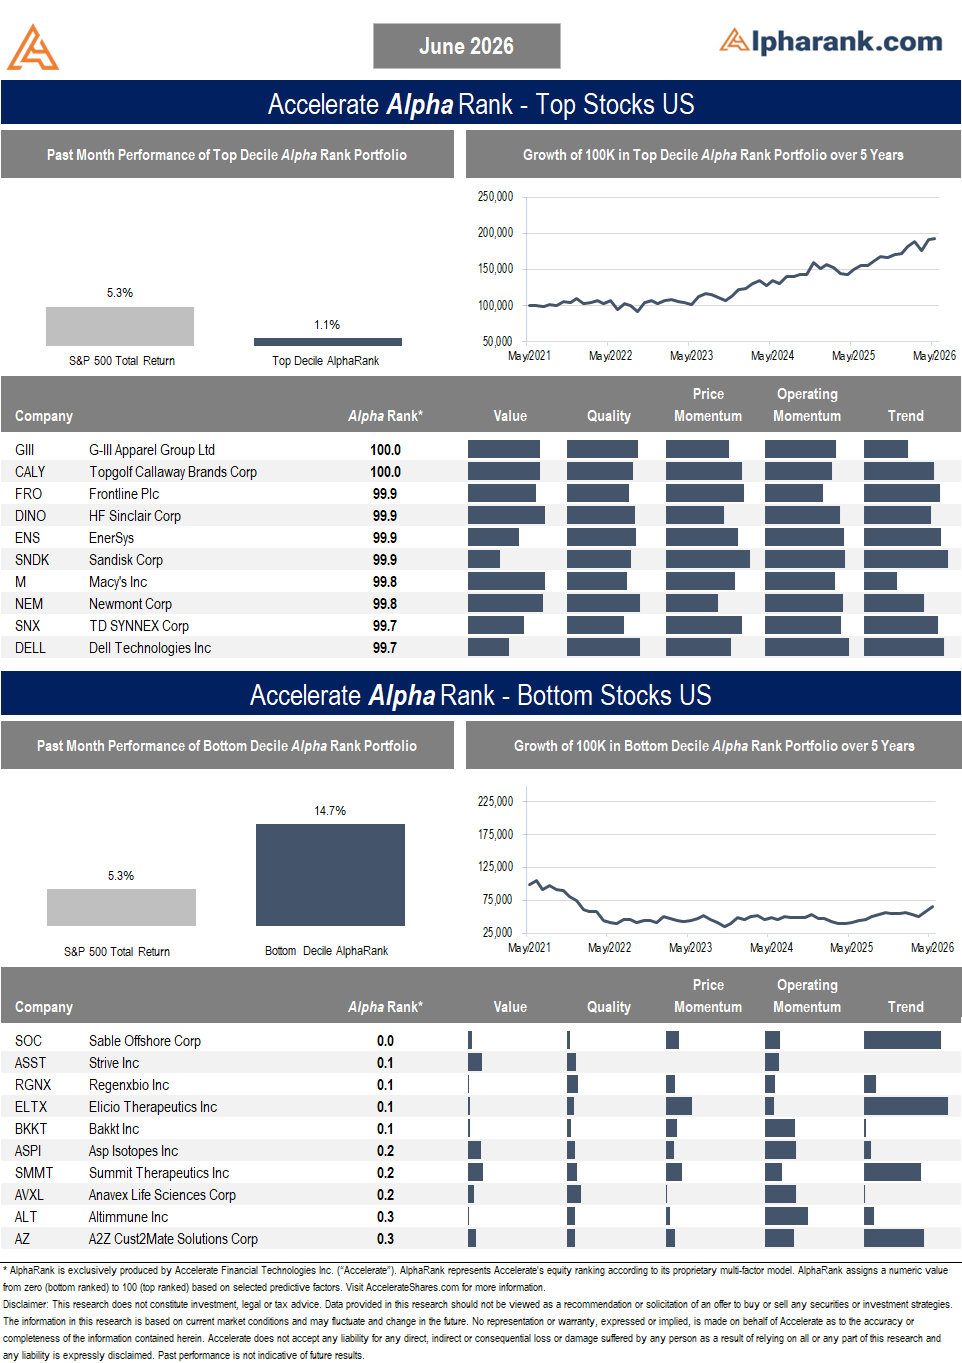
OUTPERFORM: Callaway Golf Company (NYSE: CALY) was previously known as Topgolf Callaway Brands, but after selling a majority stake in Topgolf/Toptracer to private equity, it reverted to the Callaway Golf Company name and ticker symbol CALY. The old Topgolf overhang was the main reason the stock had been punished for years. Operationally, CALY’s Q1 2026 performance exceeded market expectations. Callaway reported first-quarter net sales up 9%, net income from continuing operations up 18%, and adjusted EBITDA up 31%. Management also raised full-year 2026 guidance. CALY still trades at a below-market multiple of 9.4x EBITDA. With positive share price momentum, along with an AlphaRank score of 100/100, we expect CALY shares to continue to outperform. Disclosure: Long CALY in the Accelerate Absolute Return Fund (TSX: HDGE).
UNDERPERFORM: Abaxx Technologies Inc (NEO: ABXX) is a financial technology / market infrastructure company. Its valuation is extreme, with a market capitalization of $1.7 billion compared to revenue of just $1.5 million in the first quarter. The stock is trading at an extreme 285x annualized Q1 revenue. The company continues to experience significant operating losses, rapidly depleting its cash reserves with an uncertain path to profitability. Moreover, its share price momentum has steeply reversed over the past three months. With an AlphaRank score of 0.9/100, we expect ABXX shares to continue to underperform.
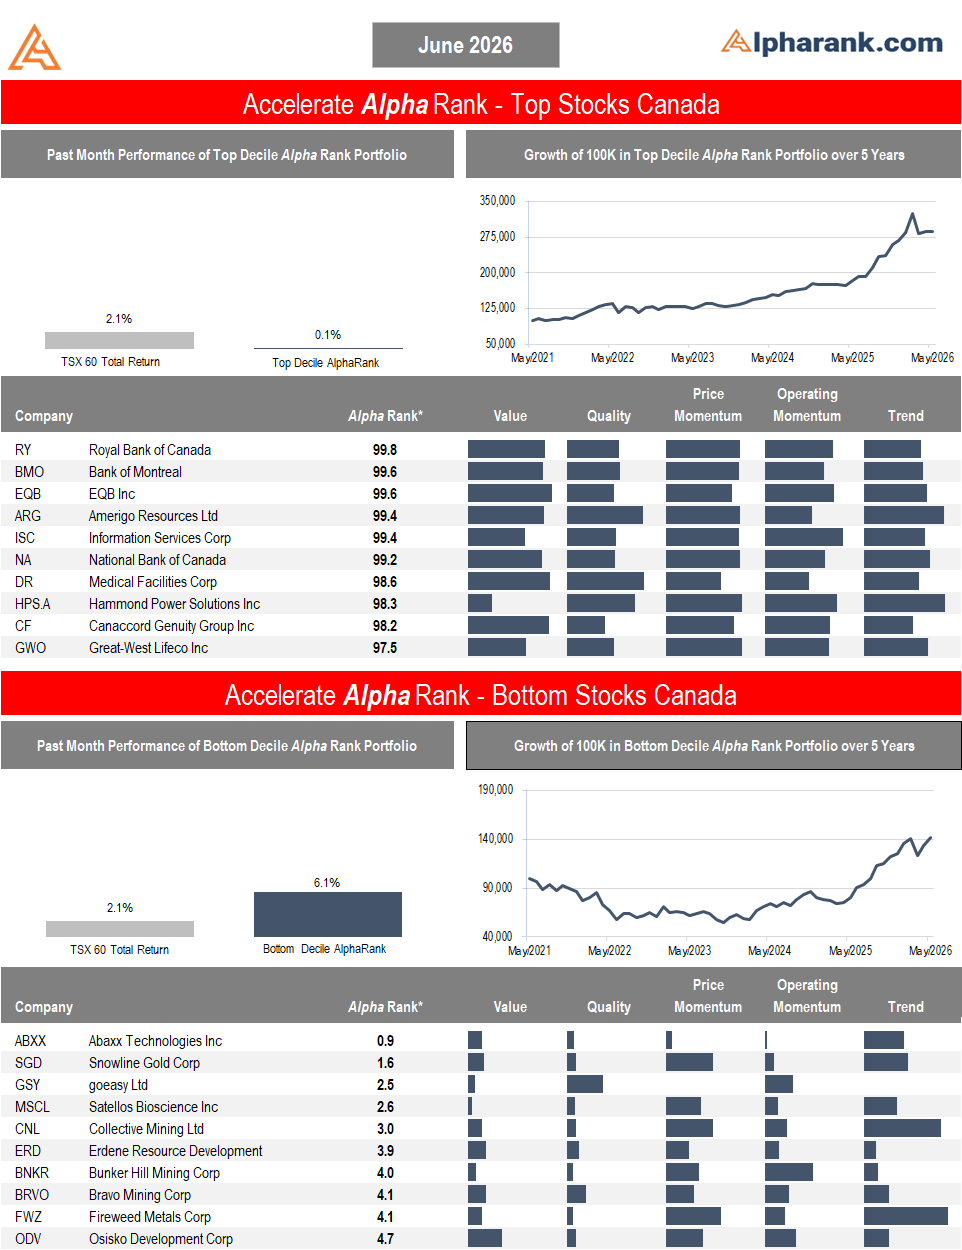
The AlphaRank Top and Bottom stock portfolios exhibited difficult relative performance last month:
- In Canada, the top-ranked AlphaRank portfolio of stocks increased by 0.1%, underperforming the benchmark’s 2.1% gain, while the bottom-ranked portfolio of Canadian equities rose by 6.1%. The long-short portfolio (top minus bottom-ranked stocks) declined by -6.0%, as the top-ranked stocks underperformed the bottom-ranked securities. Over the past five years, the top decile AlphaRank portfolio has gained 187%, while the bottom-ranked portfolio has risen by 41%.
- In the U.S., the top-decile-ranked equities rose by 1.1%, underperforming the S&P 500’s 5.3% return. Meanwhile, the bottom-ranked stocks surged by 14.7%, resulting in a -13.6% return for the top decile minus the bottom decile long-short portfolio. Over the past five years, the top-ranked U.S. equities have gained 94%, while the bottom-ranked portfolio has declined by -34%.
AlphaRank Top Stocks represents Accelerate’s predictive equity ranking powered by proven drivers of return. Stocks with the highest AlphaRank are projected to outperform, while stocks with the lowest AlphaRank are anticipated to underperform. AlphaRank assigns a numeric value to each security, ranging from 0 (bottom-ranked) to 100 (top-ranked), based on selected predictive factors. All Canadian and U.S. stocks priced above $1.50 per share and with a market capitalization exceeding $100 million are evaluated. In both the Accelerate Absolute Return Fund (TSX: HDGE) and the Accelerate Canadian Long Short Equity Fund (TSX: ATSX), Accelerate funds may be long many top-ranked stocks and short many bottom-ranked stocks. See AccelerateShares.com for more information.