

![]()
July 18, 2019 – From skinny jeans to aviator sunglasses, modern fashion is littered with trends – some a flash-in-the-pan and some enduring.
From fashion to economics, trends are often analyzed and extrapolated to make forecasts and predictions about the future. While retailers are always trying to figure out what will be the hot new fashion trend, stock analysts are always analyzing stock trends to try to forecast future returns.
One powerful methodology of measuring the trend in a stock is to look at the relative daily moving averages of the price of a stock. Specifically, looking at how a stock’s 50-day moving average compares to its 200-day moving average. A stock’s 50-day moving average refers to the average closing price over the past 50 days while the 200-day moving average refers to the stock’s average closing price over the past 200 trading sessions.
When a stock’s 50-day moving average is above its 200-day moving average, it has a positive trend. Conversely, a stock has a negative trend if its 50-day moving average is below its 200-day moving average. There’s a reason that technical analysts call it a “golden cross” when a stock’s 50-day moving average moves above its 200-day moving average and a “death cross” when the 50-day moves below the 200-day. While the nomenclature isn’t important, the trend certainly is.
Source: Accelerate, Bloomberg
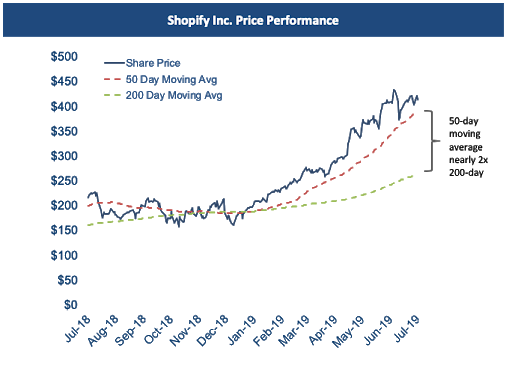
The share price graph above plots Shopify’s 1-year return, along with its 50-day and 200-day moving averages. In this example, the 50-day is nearly 2x the 200-day moving average, which denotes a bullish trend. Due to in part its positive trend, we would be long (buying) the stock (disclosure: as of the publication date, we are long Shopify).
Historically, stocks with the best trend, or the stocks whose 50-day moving average is furthest above their 200-day moving average, have had the highest returns. In addition, stocks with the worst trend, or those whose 50-day moving average is furthest below their 200-day moving average, have suffered the biggest losses.
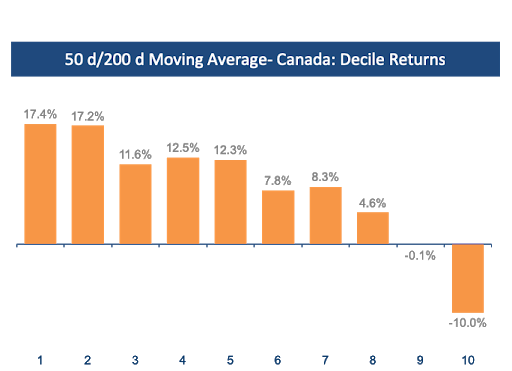
This was tested through a twenty-year simulation on both Canadian and U.S. stocks. Each month, all stocks were ranked and sorted into deciles based on the ratio of their 50-day moving average compared to their 200-day moving average. The top 10% of stocks with the best trend were grouped into decile 1, while the next best 10% of stocks based on their trends were grouped into decile 2, and so on.
Source: Accelerate, S&P Capital IQ, Compustat
The simulated twenty-year returns for each decile are plotted above. The portfolio of stocks with the best trend, decile 1, returned 17.4% annually over the past twenty years. The next best 10% portfolio of stocks, decile 2, returned 17.2% per year. Generally, the higher the trend ranking, the higher the return. For example, decile 1 (the top decile) outperforms all other trend deciles.
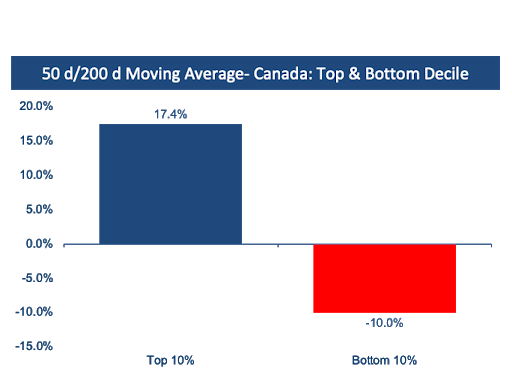
The trend factor is most noticeable at the tails – specifically the top and bottom 10% trend portfolios. The true power of the trend factor is accentuated when we focus on the extremes.
Source: Accelerate, S&P Capital IQ, Compustat
In Canada, the top decile trend portfolio returned 17.4% annualized over the past twenty years, while the bottom decile trend portfolio lost -10.0% annually. The spread between the top and bottom trend decile clocked in at 27.4% per year, a very high spread differential between the performance of the top and bottom decile trend portfolios.
Source: Accelerate, S&P Capital IQ, Compustat
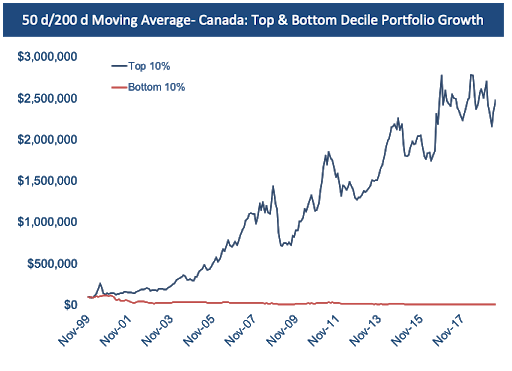
A $100,000 investment in the top decile trend portfolio in Canada twenty years ago would have grown into nearly $2.5 million. This same $100,000 invested in the bottom decile Canadian trend portfolio would have shrunk to about $12,000, a loss of nearly -90% over two decades. Clearly, paying attention to trending stocks is useful in both long and short (selling) investing.
The simulated trend portfolios show a similar result in the U.S. as well, with top trend portfolios dramatically outperforming while the lousy bottom trend portfolios lose money.
Source: Accelerate, S&P Capital IQ, Compustat
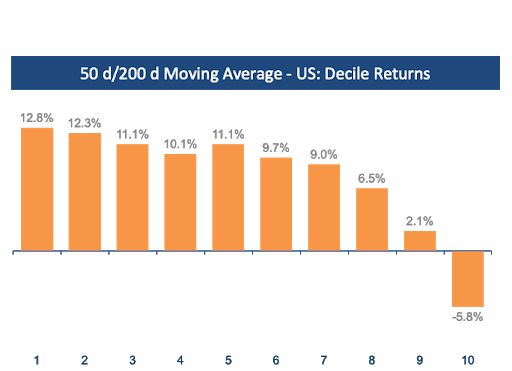
U.S. stocks exhibit a similar profile to their Canadian brethren – portfolios of stocks with the best trend have the highest returns, while the portfolios of stocks with the worst trends suffered the worst performance.
Again, we see the most extreme outperformance and underperformance in the tails. The top decile portfolio of stocks with the best trend outperformed while the bottom decile of stocks with the worst trend underperformed significantly.
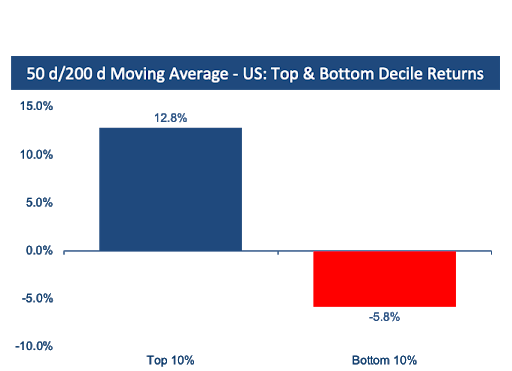
Source: Accelerate, S&P Capital IQ, Compustat
Over the past two decades, the portfolio of top-ranked trend stocks (top 10%) in the U.S. compounded at 12.8% annually. Over the same timeframe, the portfolio of the bottom-ranked trend stocks (bottom 10% ) in the U.S. lost -5.8% per year. The spread differential between the two portfolios was 18.6% per year.
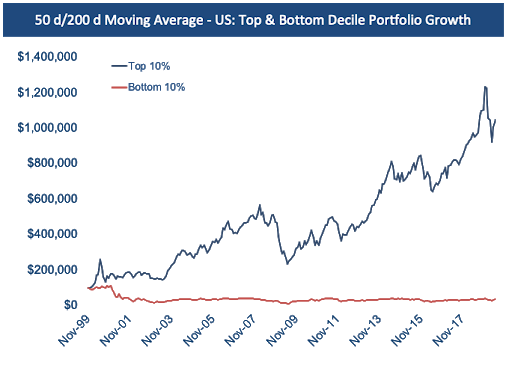
Source: Accelerate, S&P Capital IQ, Compustat
A $100,000 investment into the top decile trend portfolio in the U.S. would have grown to over $1 million over the past twenty years while the same amount invested into the bottom decile trend portfolio would have declined to less than $35,000. The bottom decile trend portfolio would have lost over -65% over twenty years.
What’s an investor to do with this data? Clearly, one should focus on owning stocks with a positive trend. In addition, an investor should avoid owning stocks with a negative trend. Enterprising investors may even consider short-selling stocks exhibiting negative trends, in order to both hedge their long portfolios and generate additional performance from short selling.
We analyze and act based on trends in all areas of life. We shop for the hottest new trends to stock our closets and eat food based on the hottest new diet to stay in shape. Don’t exclude trends from your investing. The trend is your friend when it comes to stocks – consider being long stocks with a positive trend and if you’re up for it, short stocks with a negative trend.
-Julian

