

![]()
April 23, 2019 – Fundraising for the private equity industry has been knocking it out of the park over the past number of years, with $3 trillion raised from investors since 2012. As one private equity firm remains on track to raise the largest leveraged buyout fund in history, 2019 is set to break records as the biggest yet for fundraising. In fact, the demand for private equity from institutional investors is so insatiable that the industry has over $1.2 trillion of “dry powder”, a substantial amount of capital in excess of the current investable opportunity set.
Funds Moving From Medium-Fee To High-Fee
The continued rise in private equity commitments from investors lays in stark contrast to fund flows in active long-only public equities, which continue to suffer massive net outflows. Nearly $1 trillion has been redeemed from active mutual funds over the past four years.
This dichotomy between long-only active public investing and long-only active private investing is especially perplexing given the trend of allocators moving from high-cost active strategies to low-cost passive strategies. Private equity has some of the highest fees in the investment management business, estimated at 6-7% per year. Notably, some private equity firms have been increasing their performance fees from 20% to 30%, while active mutual fund and hedge fund fees continue to be pressured to the downside.
Systematic Firms Seek To Disrupt Private Equity
Given the bounty of fees of private equity, it’s no surprise that systematic funds have developed strategies to disrupt the private equity model by replicating its returns through systematic strategies. These quantitative private equity replication strategies are now coming to the forefront.
According to a Harvard Business School study, it is possible to replicate private equity returns with liquid public securities. “A passive portfolio of small, low EBITDA (earnings before interest, taxes, depreciation, and amortization – a commonly used measure of cash flow) multiple stocks with modest amounts of leverage and hold-to-maturity accounting of net asset value produces an unconditional return distribution that is highly consistent with that of the pre-fee aggregate private equity index.”
We believe that Harvard has it right, despite claims from private equity executives insisting otherwise. Private equity firms typically insist that their market-beating investment performance comes from the “illiquidity premium”, along with operational improvements at their portfolio companies.
We have already dispelled the misconception that leveraged buyouts earn any illiquidity premium:
“The key to understanding the illiquidity premium is that it comes from somewhere – the discount you pay for an investment given you won’t be able to sell it for a while. It is from this discount in which the illiquidity premium is earned.
The problem with traditional private equity (aka leveraged buyouts) is that they typically buy an investment from a liquid public market and take it private, where it then becomes illiquid. This self-inflicted illiquidity does not magically create the illiquidity premium. As we know, the illiquidity premium comes from buying an illiquid asset at a discount compared to the price of its liquid brethren. This is where the private equity scheme falls apart. Not only do they not buy the assets at a discount, but they pay what’s called a control premium, which is typically around 30% higher than the liquid market price.”
The assertion of substantial operating improvements at private equity portfolio companies is also a dubious claim. When a company goes private in a leveraged buyout, it does so by taking on a significant amount of debt. This dramatic increase in debt results in a significantly larger portion of its operating cash flow needed to cover interest payments and debt amortization, reducing capital available for growth initiatives. In addition, many private equity firms seek to pursue a dividend recapitalization as quickly as possible after a go-private transaction, in which they look to dividend out any available cash from a portfolio company to themselves in a bid to recoup their cost base quickly. Not to mention that most publicly-traded firms are well-aware of the common financial engineering techniques that generate shareholder value, and likely have executed on these initiatives well before private equity shows up.
A study of leveraged buyouts revealed that earnings after two years under private equity ownership came in more than 33% below forecasts, according to S&P. The notion of operating improvements at private equity portfolio companies is just a smoke screen used for marketing purposes.
Replicating Private Equity
Using the tenets derived from the Harvard Business School study, a systematic multifactor model can be crafted to replicate private equity returns using liquid public securities. This private equity multifactor model is driven by three main factors:
- Size – Select a universe of small and mid cap stocks. Why? Because small and mid-cap stocks have historically outperformed.
- Value – Select top decile value stocks on EBITDA-to-EV (the ratio of earnings before interest, taxes, depreciation, and amortization to enterprise value). Why? Because historically low valuation stocks have outperformed.
- Leverage – Apply a modest amount of leverage to the portfolio. Why? Because leverage amplifies returns.
Below we run a simulation featuring North American small and mid-cap stocks in the top decile EBITDA-to-EV value factor. This monthly-rebalanced, gross-of-fees (but net of trading expenses) Private Equity Replication portfolio is shown in blue below.
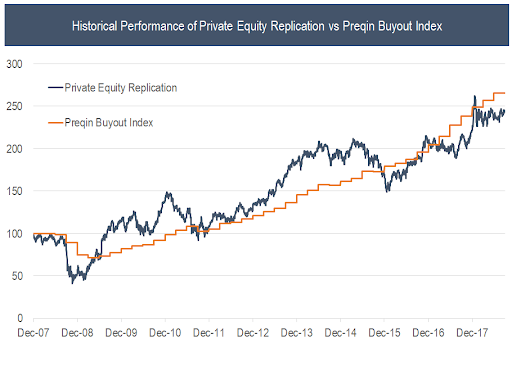
Source: Preqin, Compustat, S&P CapitalIQ
The Private Equity Replication portfolio returned 144%, or 8.8% annualized. The Preqin Buyout Index, which aggregates private equity fund returns on a quarterly basis, returned 166%, or 9.5% annualized.
Despite similar performance of the Preqin Buyout Index and the Private Equity Replication portfolio, there are some distinct differences between the two underlying portfolios, which make the Preqin Buyout Index return profile somewhat difficult to believe.
For example, the average leverage, or debt level, for leveraged buyouts in 2018 was 6.4x EBITDA. In contrast, the most recent leverage metric for the Private Equity Replication portfolio was only 1.1x EBITDA, with the most levered stock in the portfolio at 5.4x net debt / EBITDA (far lower than even the private equity average).
Somehow, the Preqin Buyout Index exhibits a fraction of the volatility of the Private Equity Replication portfolio, yet it is leveraged nearly 6x higher! This must be magic right? Perhaps it is, however, this is not the traditional magic of wizards and magicians, but the financial magic of mark-to-model accountants and analysts. Mark-to-model refers to the fact that private equity firms themselves determine the quarterly valuations of their portfolio holdings. They make sure to keep their investments out of the purview of the notoriously fickle public markets. Instead of accepting the marks of the collective market, consisting of thousands of analysts and computer algorithms coming to consensus on the price of an investment, private equity firms are blissfully free to mark their holdings to their view of “fair value” on a quarterly basis. Unsurprisingly, one firm’s view of their investment value no doubt is almost always higher than it was last quarter. This is important, because any decrease in valuation can lead to devastating unrealized losses for the private equity firms, due to the high leverage and its magnifying effects on performance.
A cardinal rule of investing dictates that the higher the leverage, the higher the volatility, and private equity portfolio companies push leverage to the max. Even mark-to-model accounting can’t dispute that. Clearly, private equity volatility (and lack thereof) is pure fantasy. The net result of mark-to-model accounting is a material understating of risk in the portfolio. But not all investors believe the low-volatility fallacy of private equity marketing materials. One of the largest investors in private equity funds even assumes that leveraged buyouts are over 30% more volatile than public equities.
If we add more leverage to the Private Equity Replication portfolio and utilize a more manager-friendly, quarterly mark-to-market pricing methodology, then our Private Equity Replication portfolio looks even better than the Preqin Buyout Index. The Leveraged & Smoothed version of the Private Equity Replication portfolio ran 130% long and hedged with a 30% short in the S&P 500 index, as shown in grey below. The smoothing comes from only marking-to-market once per quarter.
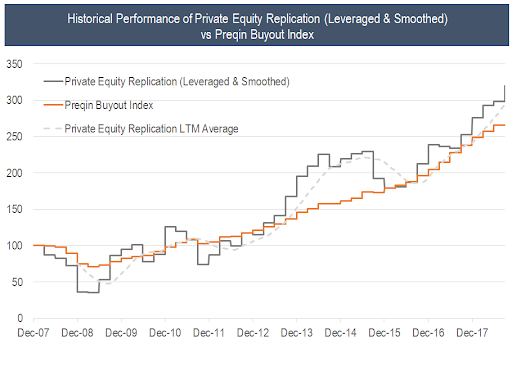
Source: Preqin, Compustat, S&P CapitalIQ
Over the measurement period, the Leveraged Private Equity Replication portfolio returned 220%, or 11.4% annualized, vs 166%, or 9.5% annualized from the Preqin Buyout Index.
Get the Benefits of Private Equity by Losing Your Account Password
Private equity’s market-beating returns generally do not come from the harvesting of the illiquidity premium, nor operational improvements at portfolio companies. The returns of leveraged buyouts come from three investment factors: value, size and leverage. Private equity performance can be replicated with systematic strategies based on these three factors.
The more one reflects, the more one realizes that the main draw of private equity is the mark-to-model accounting, which leads to investors being unaware of true underlying portfolio risk. Certainly, a portfolio of small and mid-cap stocks leveraged over 6x would exhibit some gut-wrenching volatility. Combine this with the inability to liquidate one’s investment in a private equity fund when markets are stressed, and you have a great vehicle to harvest gains from leveraged small-cap value stocks by preventing investors from making mistakes by selling at the lows.
Is the lack of liquidity, which prevents investors from making poor investment decisions, worth paying a 6-7% annual fee for? I’d recommend saving the fees, investing in a liquid private equity replication strategy and not checking your account for seven years. You’ll likely end up with a better result at the end of it.
-Julian

