

![]()
June 18, 2019 – “Own only high quality stocks” is an oft-repeated investment mantra.
We can take this investment maxim one step further and say the goal for an investor is to not only own stocks that are high quality but to not own, or even short sell, stocks that are low quality.
But what exactly is a high or low quality stock?
The Blue Chips
According to Wall Street folklore, one day during the 1920’s Dow Jones employee Oliver Gingold was watching the ticker tape. Oliver noticed a number of stocks trading at prices above $200 per share and took note. He made the analogy that in poker, the blue chips have the highest value out of all the poker chips, and christened these high-priced stocks equivalent to the high-priced blue chips in poker.
Feeling that these high-priced stocks may be exceptional, Oliver told Lucien Hooper of brokerage firm W.E. Hutton & Co. that he planned to return to his office to start writing (now known as blogging) about “these blue-chip stocks”.
Originally used to refer to high-priced stocks just as blue chips in poker carry higher values, the parlance has evolved such that blue chips now indicate stocks of high quality.
How to Measure Quality
There are numerous metrics used to measure the quality of an investment including profit margins, growth rates, balance sheet health, return on equity, accruals, etc. In fact, there is a litany of quantitative factors that could potentially measure the quality of a stock.
After analyzing and testing the vast majority of these quality factors from both a quantitative and qualitative perspective, we determined that two of the best metrics to measure the quality of a stock are:
- Return on Capital (ROC) defined as Operating Income / Invested Capital; and
- Gross Profits / Assets (GP/A).
A twenty year simulation was run to test these quality factors. The simulations ran two model factor portfolios: one that invested in the top 10% (ie. high quality) and one that invested in the bottom 10% (ie. low quality) portfolios of quality stocks, rebalanced on a monthly basis in both Canada and the U.S. The end result?
The portfolios of high quality stocks generated tremendous returns while the portfolios of low quality stocks generated large losses.
ROC-ing Out
Return on Capital, ROC, measures how efficiently a company can generate operating profits given its capitalization. A company with a high ROC is generating substantial operating profit off of its capital (typically equity and debt capital) and would be considered high quality, while a company with low ROC is typically generating losses and would be considered low quality. You would rather invest in the former rather than the latter, right? Let’s look at the numbers on the tail-ends of the distribution, specifically the top and bottom 10%.
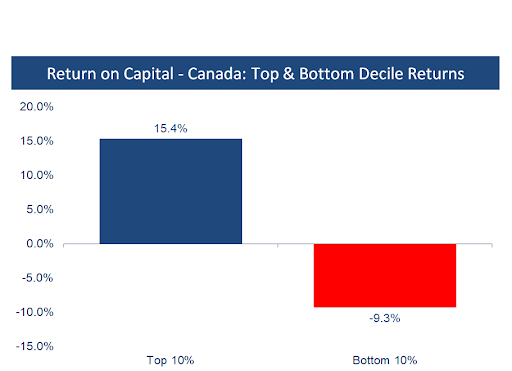
Source: Accelerate, Compustat, S&P CapitalIQ
Over the past twenty years, the portfolio of the top 10% highest quality Canadian stocks as measured by ROC, rebalanced on a monthly basis, returned 15.4% annually. A $100,000 investment in the top decile of quality stocks would have turned into $1.7 million after twenty years. Over the same timeframe, the portfolio of the bottom 10% of stocks having the lowest ROC lost -9.3% per year. That same $100,000 investment in the lowest ROC, or the bottom decile quality, stocks would have shrunk to about $15,000.
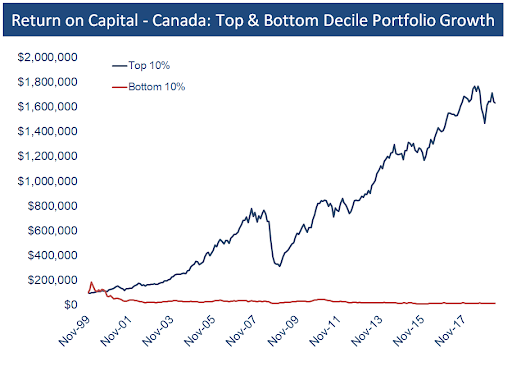
Source: Accelerate, Compustat, S&P CapitalIQ
We see a similar dynamic in the U.S. where high quality, top decile ROC stock portfolios dramatically outperformed the bottom decile, lowest ROC, quality portfolios.
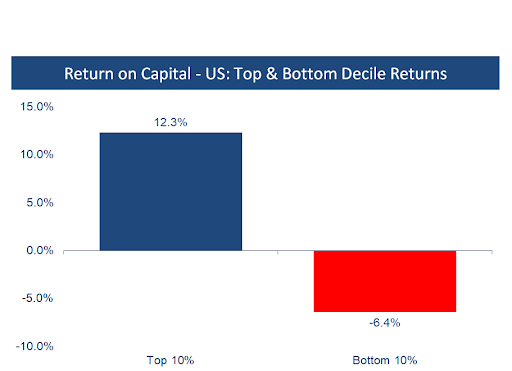
Source: Accelerate, Compustat, S&P CapitalIQ
The top decile quality U.S stock portfolio returned 12.3% annually over the past twenty years while the bottom decile ROC or lowest quality portfolio lost -6.4% annually over the same two decades.
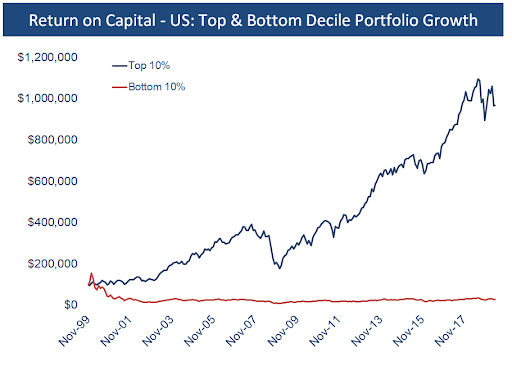
Source: Accelerate, Compustat, S&P CapitalIQ
A $100,000 investment in the top 10% high ROC U.S. stock portfolio would have grown to over $1 million while a $100,000 investment in the bottom 10% low ROC U.S. stock portfolio would have shriveled to just under $27,000.
“Enough to make you throw up, man, it’s gross what I net” – Drake
Gross Profits are anything but. In fact, they’re quite sweet – gross profits are the difference between a company’s revenue and its cost of goods sold. The bigger, the better. When looked at as a percentage of a company’s assets, Gross Profits / Assets or GP/A, measures how well a company can sell goods or services profitably from its asset base. As a measure of a business’ efficiency, GP/A is closely related to ROC.
Unsurprisingly, stocks possessing a high GP/A, a characteristic of high quality stocks, have generated significant share price outperformance. Conversely, stocks with a low GP/A have underperformed dramatically.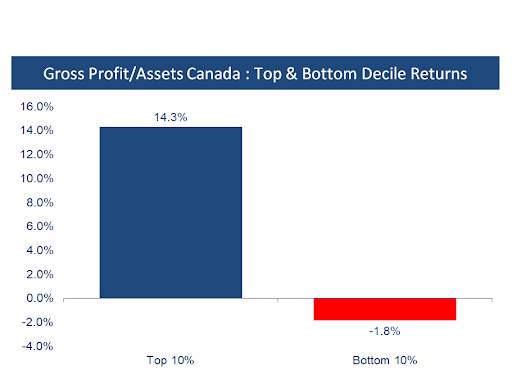
Source: Accelerate, Compustat, S&P CapitalIQ
In Canada, a portfolio of the top decile quality stocks as measured by GP/A compounded at 14.3% per year over the past twenty years. A portfolio of the bottom decile quality stocks, or those with the lowest GP/A, lost -1.8% per year.
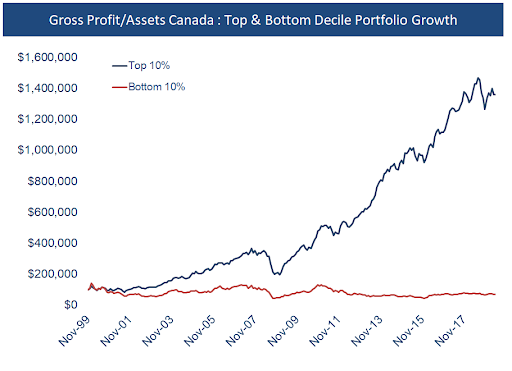
Source: Accelerate, Compustat, S&P CapitalIQ
A $100,000 investment in a portfolio of top decile GP/A quality stocks in Canada would have turned into over $1.4 million over the past twenty years while the same $100,000 invested in a portfolio of bottom decile GP/A Canadian stocks would have declined to about $70,000.
As one would expect, we see a similar result in U.S. equities. A portfolio of high quality GP/A U.S. stocks generated substantial outperformance while a portfolio of low quality GP/A equities underperformed markedly.
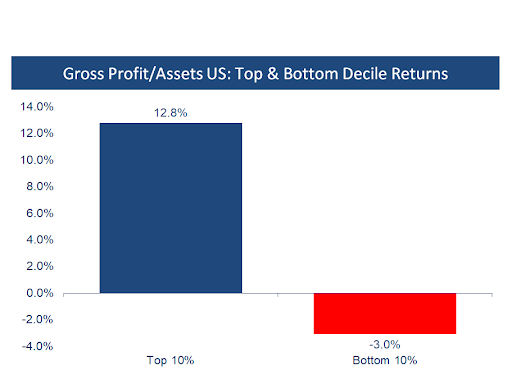 Source: Accelerate, Compustat, S&P CapitalIQ
In the U.S., a portfolio of top decile GP/A stocks returned 12.8% over the past two decades while the bottom decile portfolio, or lowest quality stocks, lost -3.0% per year.
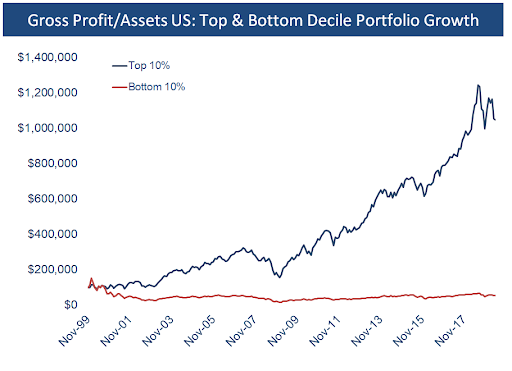
Source: Accelerate, Compustat, S&P CapitalIQ
Similar to the other top decile quality portfolio performances, a $100,000 investment in a portfolio of the top U.S. quality stocks as determined by GP/A grew to over $1 million over the past twenty years. The bottom decile portfolio of low-quality U.S. stocks struggled, with a $100,000 investment losing nearly half its value over the two decades.
Top Quality All Day
As the data shows, the investment maxim “own only high quality stocks” has been proven correct. However, given the substantial underperformance of low quality stocks, we may need to add to the quality investing mantra:
“Own only high quality stocks and short only low quality stocks”.
-Julian

