


November 12, 2023 – Amongst investors, the “R-word” is rearing its ugly head again.
A much-predicted and dreaded recession, classically defined as two consecutive quarters of negative real GDP growth, is upon us.
Last week, Statistics Canada released preliminary GDP estimates for September, indicating a -0.1% annualized decline for the Canadian economy in the third quarter. This economic contraction in Q3 followed a -0.2% annualized drop in the second quarter, confirming a recession under the textbook definition, albeit a very weak one at this point.
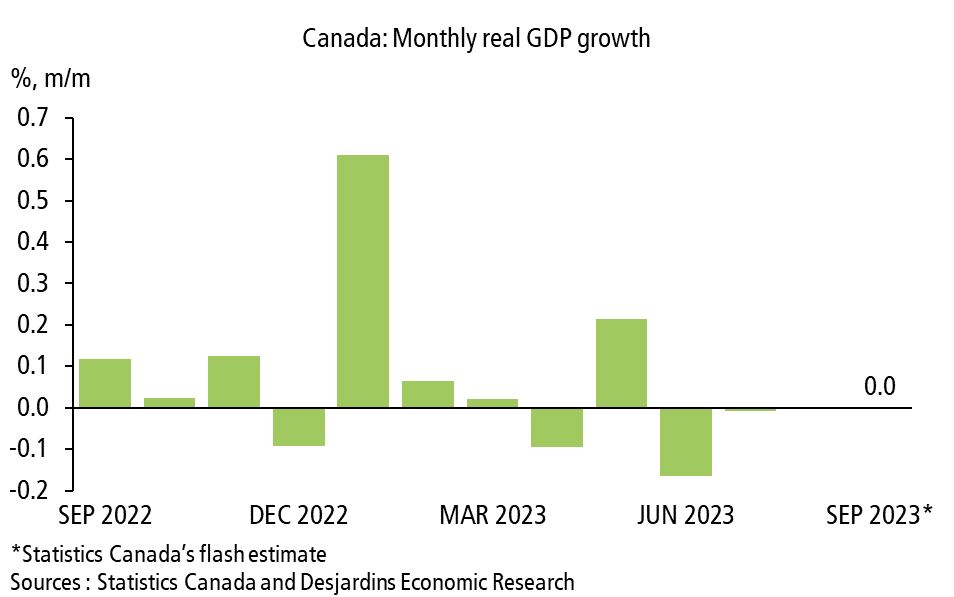
Nonetheless, whether the economy is in a recession is typically a heated debate. Not all parties are so accepting of the textbook definition of two subsequent quarters of negative real GDP growth. Governments, acknowledging that economic performance plays a significant role in their ability to get re-elected, are quick to dismiss any recession talk, irrespective of weakness in the economy.
The “official” arbiter of recessions in Canada is the C.D. Howe Business Cycle Council, which defines “a downturn as a recession if there is, broadly speaking, a pronounced, persistent, and pervasive decline in aggregate economic activity.”
C.D. Howe says that in order to officially declare an economic recession, “three dimensions need to be considered simultaneously: amplitude, duration, and scope – or how widespread a downturn is.” Much hand-waving is involved. Governments prefer to hide behind this much more subjective definition because it takes much longer to adjudicate, and once made official, the recession is typically months, or even quarters, behind us. For us market participants, the simple textbook definition is much more timely and constructive in defining the current economic environment. In any event, irrespective of definitions, Canada is in an economic slowdown, which has specific implications for investors.
In contrast, the U.S. economy remains strong, with Q2 and Q3 GDP growth prints of +2.1% and +4.9%, respectively. While the inverted yield curve has been flawless regarding its recession predictions over the past six decades, many are questioning its accuracy as the much-expected 2023 economic contraction in the U.S. has not emerged. In addition, the Atlanta Fed and consensus projections forecast continued U.S. economic strength into year-end.

If a U.S. recession has been delayed to a 2024 story, weakness has not yet shown up in the numbers. That being said, numerous corporations in economically sensitive sectors, such as luxury goods manufacturers, are indicating that high interest rates are finally wearing on consumers.
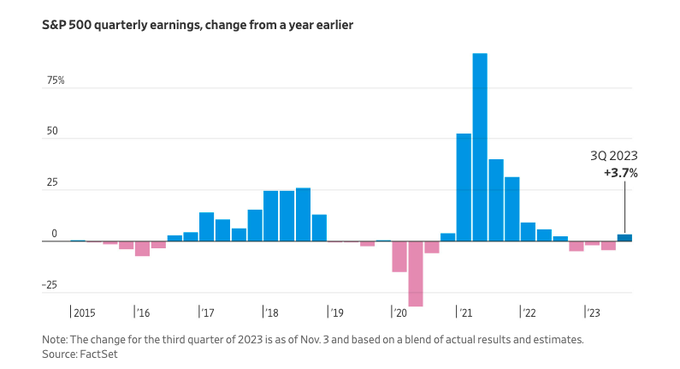
Historically, an earnings recession typically portends stock market weakness in the form of a correction (down -10%) or a bear market (down -20%). This price action was confirmed last month, as the S&P 500 declined -10.6% from its July peak to its October low, marking an official stock market correction.
Despite the earnings contraction, the S&P 500’s rock-solid valuation of nearly 20x earnings has remained largely intact. The strength of the leading U.S. large-cap growth stocks was too much for stock market bears to tame. The top 10 securities in the benchmark index have produced a stunning 134.1% of the S&P 500’s year-to-date return. The remaining S&P 490 has been a poor investment. The index’s equal-weight performance has been negative, and small-cap stocks have been left in the dust by their jumbo-cap brethren.
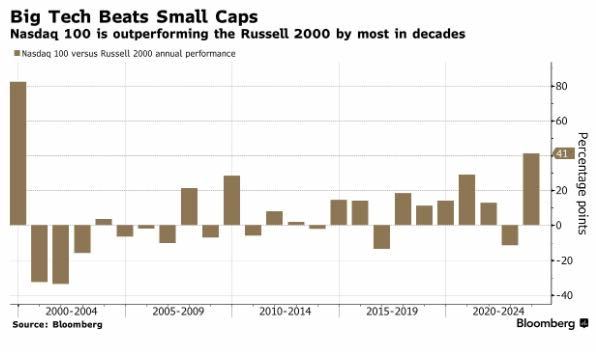
This year’s market darling, the Nasdaq 100, has outperformed the small-cap Russell 2000 by more than 40% year-to-date, its most significant outperformance since the peak of the tech bubble in 1999.
Given the relentless strength in the index’s most significant constituents, it is no wonder that short interest in the market’s “magnificent seven” has reached an all-time low.
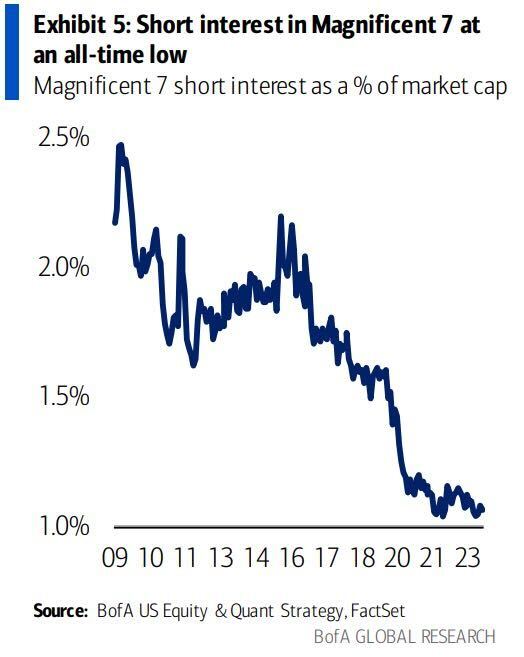
What equity bear wants to get steamrolled by the continued momentum of the most significant seven stocks driving the S&P 500? While their valuations are high, it is not just sentiment driving the tremendous outperformance of the market’s largest names. The Microsofts and the Nvidias of the world are performing exceptionally well from a fundamental business perspective. The main question is whether this operating outperformance can continue.
In any event, what matters to investors is where we go from here. As economic weakness gains momentum into 2024, while inflation continues to subside, it is becoming increasingly clear that central banks have likely finished their hiking cycle. Investors must now forecast when a rate-cutting cycle will begin and plan accordingly.
While market prognosticators were dead wrong about the commencement of an expected 2023 rate-cutting cycle during the bear market of 2022, the outlook for potential rate cuts in 2024 is looking more probable. Consensus estimates call for rate cuts to commence next summer, with the expectation of three cuts by the fourth quarter of 2024. Although the Federal Reserve would push back on this prediction, given their most recent dot plot calling for a Fed funds rate above 5% at the end of next year, economic indicators appear to be coming in favour of market participants, who are banking on rate cuts to justify the lofty valuations of U.S. large-cap equities.
Regardless, investors must be prepared for two major themes heading into next year:
- Continued economic and stock market weakness
- Interest rate cuts
Market participants should not bank on the Fed bailing them out again. Inflation risks remain, and therefore, the Federal Reserve is less likely to implement the “Fed put” to bail out the stock market should it hit some turbulence. In addition, the Federal Reserve continues its quantitative tightening program, recently shrinking its bloated balance sheet from $9 trillion to just under $8 trillion. Note that the Fed’s balance sheet was just above $4 trillion before the COVID-19 pandemic, so the central bank has its work cut out for it in terms of continued balance sheet reduction and the removal of liquidity from the system.
Investors should not be overly reliant on another potential flood of liquidity and a fifth iteration of quantitative easing, given the explosion in inflation after the implementation of QE4.
However, allocators need to prepare for a recession and fortify their portfolios against economic weakness heading into 2024. In addition, investors need a plan for their cash holdings as rates come down. T-bills and high-interest savings accounts will become less attractive as central banks cut rates (especially on an after-tax basis).
October was another negative month for traditional asset classes. Stocks fell for the third month in a row, while bonds dropped for the fifth consecutive month.
In contrast, absolute return has had positive performance for five months in a row, closing the month at new all-time highs.
Due to the high correlation between stocks and bonds, the fixed-income portion of a portfolio has ceased to be a diversifier. The 60/40 stock and bond portfolio has been performing very similarly to a 100% equity portfolio, and therefore, adding fixed income to an equity portfolio provides little benefit. Given their high correlation, there is effectively no difference between a 60/40 portfolio and a 100% stock portfolio, in the current market environment. Investors need to look elsewhere for their diversification needs.
In constructing robust portfolios that can hold up during a recession, it is important to include uncorrelated strategies such as absolute return. Uncorrelated or negatively correlated strategies can provide positive performance to a portfolio when stocks and bonds are falling.
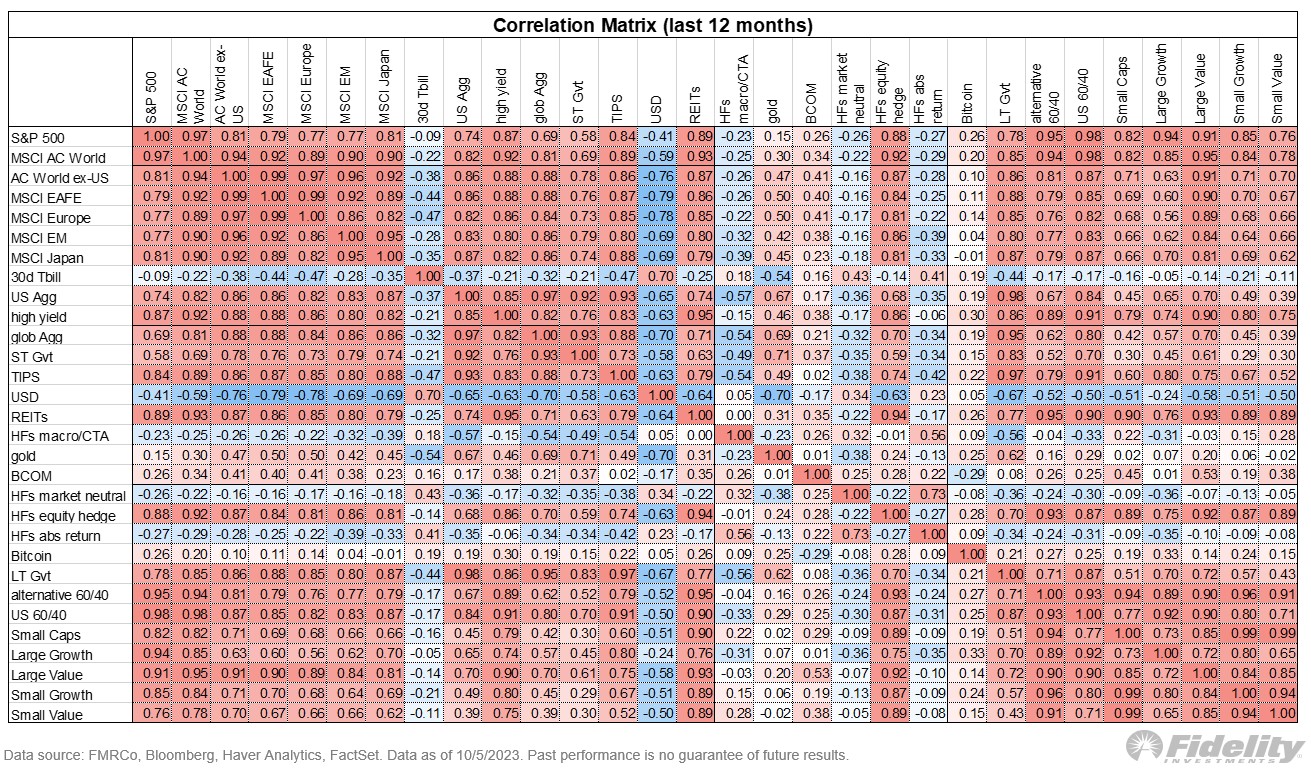
The detailed table below provides an excellent framework for investors using correlations of various asset classes and strategies to help guide their asset allocation.
Specifically, allocators should focus on the rows that are coloured light-pink (low correlation), white (uncorrelated), or blue (negatively correlated) when adding diversifiers to a stock portfolio. Asset classes and strategies that fit the bill include absolute return, global macro, managed futures, market-neutral equity, T-bills, gold, and bitcoin. We expect these asset correlations and their benefits to investors’ portfolios to continue into the future.
Accelerate manages four alternative ETFs, each with a specific mandate:
- Accelerate Arbitrage Fund (TSX: ARB): Cash Plus
- Accelerate Absolute Return Hedge Fund (TSX: HDGE): Portfolio Protector
- Accelerate OneChoice Alternative Portfolio ETF (TSX: ONEC): Portfolio Stabilizer
- Accelerate Enhanced Canadian Benchmark Alternative Fund (TSX: ATSX): Canadian 150/50
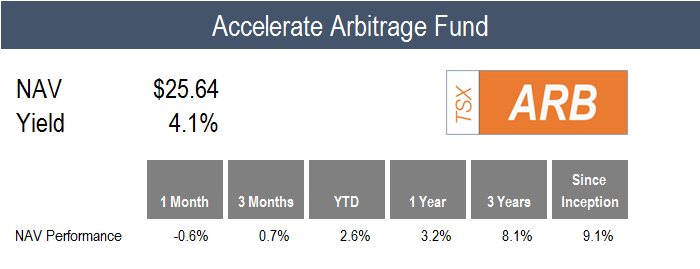
ARB declined by -0.6% in October, while the benchmark S&P Merger Arbitrage Index gained +0.3%.
The Fund underperformance was driven by two holdings.
First, VMWare rolled passed its election deadline for its acquisition by Broadcom. The default election, cash, is worth just $142.50 per share, while the cash and stock election, worth nearly $200.00, is no longer open for shareholders to elect. Therefore, VMWare shares trade far below their elected value as uncertainty on the deal closing continues. This spread will close if/when the merger is completed.
Second, the Fund had a small position in acquisition target Velan, which was set to be acquired by Flowserve until the French government blocked the transaction. The Fund had exited 75% of its position prior to the deal termination as the deal had hit some turbulence and delays. The Fund planned to exit the entire position before the outside date. Unfortunately, the stock was halted a couple of days prior to the deal’s official termination date, preventing the Fund from exiting the remaining position prior to the termination-led share price drop.
On a positive note, ARB was awarded a global top 10 ranking by BarclayHedge in its arbitrage category for September. In addition, while ARB did not win the HFM U.S. Performance Award for “Best Arbitrage Fund”, it was an honour to be shortlisted among the top 6 candidates.

![]()
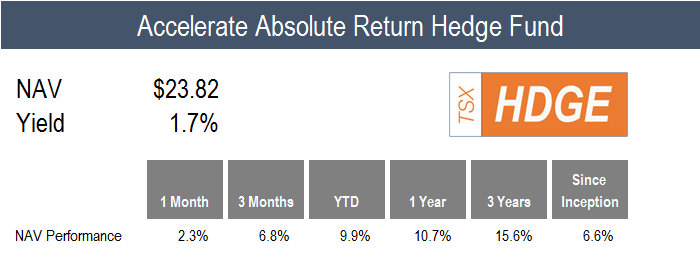
Positive monthly factor performance continued last month, driving a +2.3% gain for HDGE amidst a backdrop of negative performance for traditional asset classes.
The current market environment is constructive for an absolute return strategy for two reasons:
- Relatively high short-term interest rates, allowing beta-neutral strategies to generate attractive rates of return on the Fund’s cash held from short sales
- High divergence between various factors, including the substantial gulf between overvalued and undervalued stocks and high-quality and low-quality securities
These positive drivers of returns have emerged over the past 18 months and are expected to continue as tailwinds in the near-term.
All U.S. factor portfolios generated positive performance for the month. While the long side of each factor portfolio declined by mid-single digits, multifactor long-short portfolio gains for the month were driven by the short portfolios, all of which dropped by more than -10%.
![]()

They say, “All that glitters is not gold”, but it is tough to argue against the case for gold within a diversified portfolio of alternative asset classes.
The precious metal powered ONEC’s 0.9% gain in October, as the so-called barbarous relic surged +6.7% above $2,000 per ounce.
However, ONEC’s diversified allocation also featured several asset classes with positive monthly performance. Absolute return gained +2.3%, and infrastructure ticked up +0.5%.
On the negative side of the performance ledger, risk parity took the brunt of it, declining -3.3% in October, while long-short equity fell -2.3% and commodities dropped -1.7%. The private credit, real estate, managed futures, and arbitrage allocations hung in there, with all declining by less than -1%.
![]()
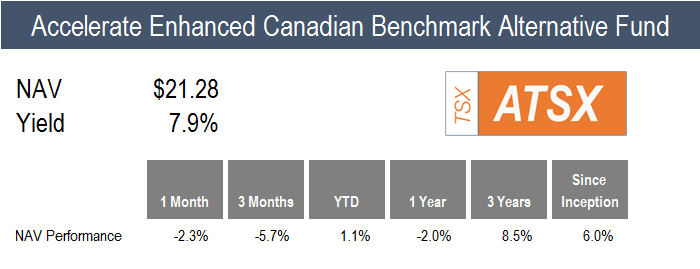
ATSX declined by -2.3% in October, while its benchmark, the TSX 60, fell by -3.2%.
The Fund’s 50% long/50% short alpha overlay portfolio added +0.9% of outperformance for the month.
Multifactor long-short portfolios generated positive performance in October’s declining market. The main contributing factors were quality and operating momentum. Specifically, the stocks with positive operating momentum gained +3.8%, while the securities with negative operating momentum fell by -6.0%. The operating momentum factor composite is driven by various sub-factors, including the cadence of earnings estimates, share repurchases/issuance, and quarterly beats/misses.
The performance of the Fund’s long/short overlay was also driven by the quality factor, as high-quality Canadian stocks gained +0.9%, while low-quality issues dropped -3.6%.
![]()
Have questions about Accelerate’s investment strategies? Click below to book a call with me:

Disclaimer: This distribution does not constitute investment, legal or tax advice. Data provided in this distribution should not be viewed as a recommendation or solicitation of an offer to buy or sell any securities or investment strategies. The information in this distribution is based on current market conditions and may fluctuate and change in the future. No representation or warranty, expressed or implied, is made on behalf of Accelerate Financial Technologies Inc. (“Accelerate”) as to the accuracy or completeness of the information contained herein. Accelerate does not accept any liability for any direct, indirect or consequential loss or damage suffered by any person as a result of relying on all or any part of this research and any liability is expressly disclaimed. Past performance is not indicative of future results. Visit www.AccelerateShares.com for more information.

