

September 12, 2022 – The global financial crisis of 2008 and 2009 caused a recessionary bear market for the ages.
When Lehman Brothers filed for bankruptcy, it appeared that the world’s financial system may go off the rails. Stock markets worldwide were plunging, the capital markets were ceasing up, and businesses and livelihoods were at risk.
Thankfully, central banks stepped in with unprecedented monetary policy to save the global economy.
Specifically, central bankers engaged in coordinated, global, and novel monetary policy that included bringing interest rates to zero and implementing quantitative easing.
Quantitative easing, in which the central bank effectively prints money to buy Government bonds and mortgage-backed securities, was effected to spur the “wealth effect” and to manifest economic growth.
In 2010, then Federal Reserve Chairman Ben S. Bernanke said the following regarding quantitative easing:
“This approach eased financial conditions in the past and, so far, looks to be effective again. Stock prices rose and long-term interest rates fell when investors began to anticipate this additional action. Easier financial conditions will promote economic growth. For example, lower mortgage rates will make housing more affordable and allow more homeowners to refinance. Lower corporate bond rates will encourage investment. And higher stock prices will boost consumer wealth and help increase confidence, which can also spur spending. Increased spending will lead to higher incomes and profits that, in a virtuous circle, will further support economic expansion”
These unconventional and experimental central bank actions had the intended effect. The global economy was saved from the brink and escaped a potential economic depression.
Although quantitative easing (“QE”) and a zero interest rate policy (“ZIRP”) saved the world from a global depression, the problem was perhaps they worked too well. Like a junkie after its first hit, the economy was hooked. Getting it off QE and ZIRP would prove to be problematic.
Quantitative easing, with its intended wealth effect, caused the Federal Reserve’s balance sheet to balloon.
From 2008 to 2009, the Fed’s balance sheet doubled from $1 trillion to $2 trillion.
After the first implementation of QE in 2009, QE2 was not far behind. Showcasing the difficulty in getting off the easy financial conditions gravy train, the Fed implemented the third iteration of quantitative easing (“QE3”) in 2012.
The U.S. central bank tried to wean itself off its money-printing addiction, implementing its first quantitative tightening (“QT”) experiment in 2018. By this time, the Fed’s balance sheet had ballooned to $4.5 trillion from the implementation of three hits of QE.
Its first attempt to shrink its balance sheet in 2018 was a disaster. Stocks tanked, and after roughly ten months, the central bank reversed the policy.
Then came the Covid pandemic, and the Fed put its money printing machine into overdrive as it implemented QE4 to stave off another potential economic depression.
In 2020, the Federal Reserve’s balance sheet surged from $4 trillion to $7 trillion.
Even after the global economy had recovered, the Fed continued to stimulate. Its balance sheet peaked at $9 trillion earlier this year, 9-fold higher than when the first round of QE began.
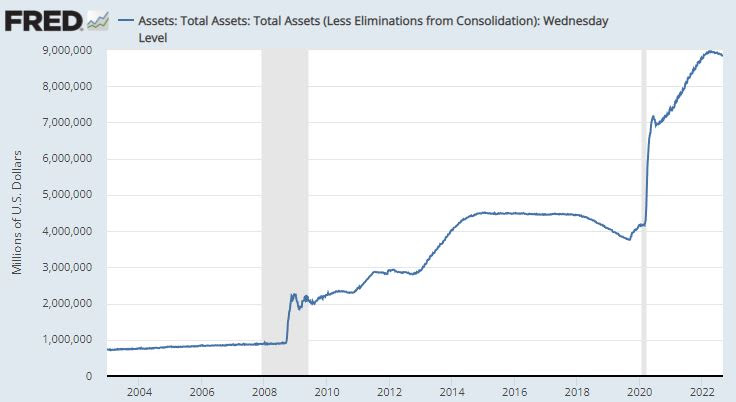
Source: Board of Governors of the Federal Reserve System (US)
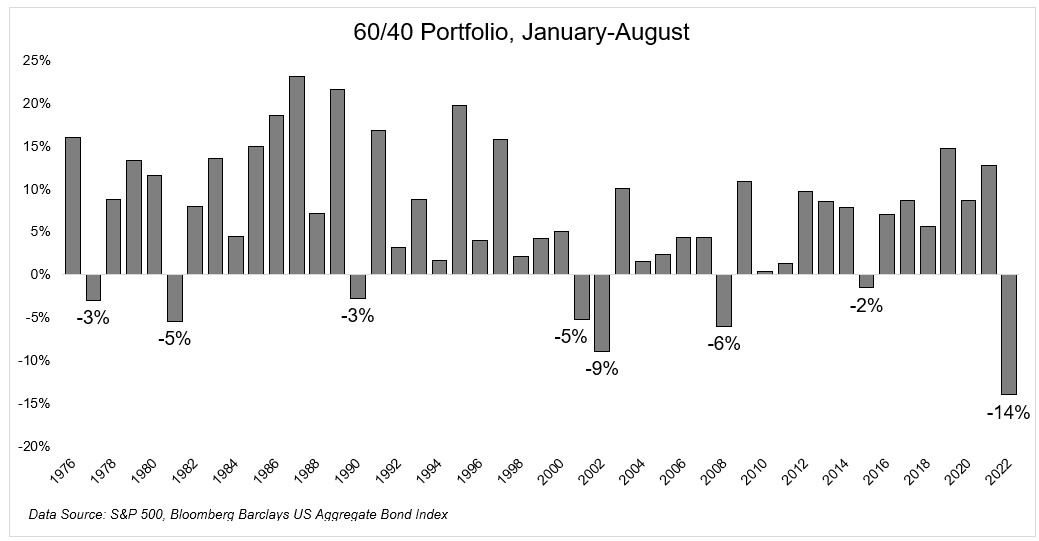
Now, quantitative tightening just commenced, and the central bank’s assets have only declined about 1% since their peak in April. Accordingly, risk assets have been smoked, with the 60/40 stock and bond portfolio experiencing its worst performance on record (down -14% year-to-date).
For allocators, investing in an age of quantitative tightening is wrought with risks.
Principally, if QE was implemented to spur the wealth effect given its goal of increasing stock prices, it is logical to assume that QT would have the reverse effect.
Specifically, the opposite of the wealth effect is a stock market decline (or at least valuation compression), and that is what’s likely under a regime of Fed balance sheet shrinkage.
In addition to the risks associated with quantitative tightening, equity investors should be focused on rising interest rates.
While increasing rates are obviously a headwind for stock investors, it is important to note the historical effect of rate hikes/cuts on equity bull and bear markets.

Stock investors should know that historically, bear markets have ended end after the Fed cuts rates. The central bank is still on a rate hiking cycle, and investors shouldn’t expect a potential rate cut until well into 2023 at the earliest.
In the current bear market, there likely won’t be a bottom in equities until the 2-year Treasury yield falls by at least 50bps. The stock market needs declining short-term rates, not increasing rates, to stage a sustained rally.
Until the Fed reverses course and cuts interest rates, look for choppy markets, new stock market lows and head fake bear market rallies (which we had in July).
Heed the warning and “don’t fight the Fed”.
Do not be positioned poorly during Fed’s quantitative tightening program, which is just ramping up. Stay diversified.
Accelerate manages five alternative ETFs, each with a specific mandate:
- Accelerate Arbitrage Fund (TSX: ARB): SPAC and merger arbitrage
- Accelerate Absolute Return Hedge Fund (TSX: HDGE): Long-short equity
- Accelerate OneChoice Alternative Portfolio ETF (TSX; ONEC): Alternatives portfolio solution
- Accelerate Enhanced Canadian Benchmark Alternative Fund (TSX: ATSX): Buffered index
- Accelerate Carbon-Negative Bitcoin ETF (TSX: ABTC): Eco-friendly bitcoin
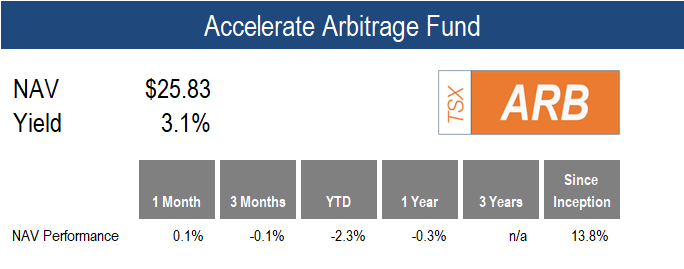
ARB gained 0.1% in August, a month in which the majority of asset classes suffered price declines.
During the month, SPAC arbitrage yields increased from 5.5% to 5.6% while merger arbitrage yields declined from 13.1% to 11.4%.
The yields offered within the arbitrage complex compare quite favourably to traditional fixed income.
For example, SPACs now yield 120bps more than the global bond index, despite SPACs having arguably a significantly lower risk profile.
Also, merger arbitrage yields 400bps more than the high-yield bond index with a fraction of the duration.
There are nearly 100 merger arbitrage opportunities in North America worth about $600 billion and 678 SPAC arbitrage opportunities worth $166 billion. There’s always something to do.
ARB remains approximately 75% allocated to SPAC arbitrage and 25% allocated to merger arbitrage, with roughly 1.5x leverage.
![]()

HDGE declined -3.3% last month as both long and short multifactor portfolios fell.
U.S. multifactor long-short performance was negative as short portfolios fell slightly less than long portfolios. The biggest detractor of performance was the quality factor, in which high-quality stocks fell by -4.1% and low-quality equities declined by just -3.1%.
Long-short value and trend in HDGE’s US-focused portfolios declined, with some respite from the positive performance from both price momentum and operating momentum long-short factors.
In any event, HDGE’s short portfolio did not fall far enough to offset the declines in the long book, ergo a negative monthly result ensued.
![]()
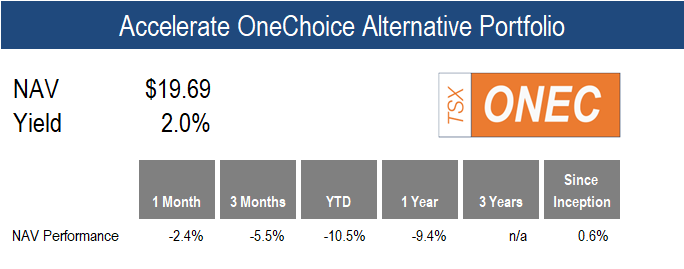
ONEC declined -2.4% in August in a difficult month for risk assets.
Two of the ten strategies which ONEC allocates to generated positive returns for the month. Leveraged loans gained 1.2% while arbitrage ticked up 0.1%.
Mortgages, enhanced Candian equity, infrastructure and gold declined by less than -3%.
Performance of alternative strategies including long-short equity, real estate, risk parity and bitcoin was negative by more than -3%.
![]()
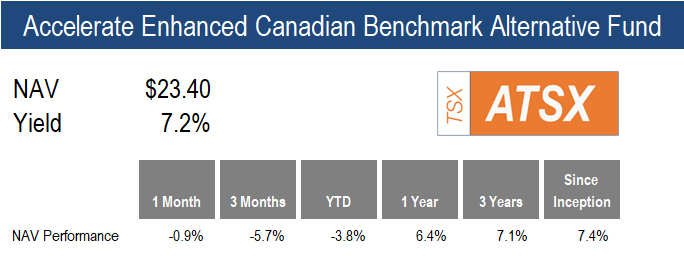
ATSX declined -0.9% last month, ahead of its benchmark TSX 60’s -1.6% fall.
The Fund generated 0.7% of outperformance as Canadian long-short factor portfolios performed quite well, with each long-short factor portfolio contributing positive returns.
Although all long and short portfolios declined, ATSX’s overlay portfolio’s long holdings generally held up better than its shorts.
The main factors that generated the outperformance were long-short value and trend, as undervalued stocks outperformed overvalued by 3.9% and stocks with a positive trend outperformed those with a negative trend by 4.8%.
![]()
Have questions about Accelerate’s investment strategies? Click below to book a call with me:

-Julian
Disclaimer: This distribution does not constitute investment, legal or tax advice. Data provided in this distribution should not be viewed as a recommendation or solicitation of an offer to buy or sell any securities or investment strategies. The information in this distribution is based on current market conditions and may fluctuate and change in the future. No representation or warranty, expressed or implied, is made on behalf of Accelerate Financial Technologies Inc. (“Accelerate”) as to the accuracy or completeness of the information contained herein. Accelerate does not accept any liability for any direct, indirect or consequential loss or damage suffered by any person as a result of relying on all or any part of this research and any liability is expressly disclaimed. Past performance is not indicative of future results. Visit www.AccelerateShares.com for more information.

