


April 7, 2024 – The North Star, also known as Polaris, is a prominent star that has held significant importance throughout history for its use in navigation. It is located nearly directly above the Earth’s North Pole, making it an almost stationary point in the night sky, allowing for its use as a vital tool in navigation before the advent of modern technology such as satellites and GPS.
For more than a thousand years, the North Star was the primary technology used by explorers to navigate both the sea and the land. Ancient civilizations, including the Phoenicians and Greeks, understood the principles of celestial navigation and used the stars, including Polaris, to navigate the seas. The Vikings, skilled seafarers of the early medieval period, navigated the North Atlantic and beyond. They are believed to have used the North Star, among other celestial bodies, to guide their voyages from Scandinavia to far-off lands such as Greenland and Newfoundland. European navigators and explorers relied on the North Star for latitude navigation when travelling to the New World and around the globe.
Just as the ancient navigator’s North Star helped them navigate the land and seas, current-day rational investors are guided through the capital markets by fundamentals.
Rational stock market analysis indicates that the intrinsic value of an equity security is equal to the discounted value of its future cash flows. When calculating a stock’s intrinsic value, the two main fundamental factors are the rate of growth in which the future cash flows are growing (earnings growth rate) and the discount rate used to determine the future cash flows’ present value (interest rate).
The sky can be filled with hundreds of stars on a clear night. A trick we learned as kids to pinpoint the North Star is using a more recognizable constellation, the Big Dipper, as a guide. The Big Dipper’s “pointer stars,” Dubhe and Merak (the two stars forming the outer part of the Big Dipper’s bowl), create a line that points directly to Polaris. By drawing an imaginary line through these stars and extending it outward, you will find it points almost exactly to Polaris.
Just as Dubhe and Merak guide explorers to Polaris, earnings growth and the interest rate lead to investors’ North Star, fundamental value.
However, the dynamic and emotion-filled world of investing does not behave in such an orderly way as a rules-based physics framework.
One of history’s most influential scientists, Sir Isaac Newton, has made great contributions to not only astronomy, but also to physics, mathematics, and philosophy. It is most ironic and perhaps comically fitting that one of history’s most accomplished and brilliant humans lost a fortune in stock market speculation.
The South Sea Bubble was one of the earliest documented financial manias, in which a speculative fervour pushed up equity prices to irrational levels before the bubble burst and the market crashed, causing ruin and heartache amongst traders. At that time, Isaac Newton, like many others, invested heavily in the South Sea Company, which was granted a monopoly on trade in the South Seas in exchange for assuming England’s national debt. Initially, Newton profited from his shares, but as the stock price continued to soar due to rampant speculation, he re-entered the market with a larger amount and eventually faced significant losses when the stock bubble burst.
After his disastrous misadventure with stock market speculation during the South Sea Bubble, Newton reflected on the experience. He allegedly stated, “I can calculate the motion of heavenly bodies, but not the madness of people.” This quote highlighted his frustration and the irony that despite his profound understanding of the laws governing the natural world, he found it challenging to predict or understand human behaviour, specifically in the capital markets. The quote encapsulates the unpredictable nature of human psychology and the difficulty of forecasting collective human actions, which can often seem irrational or driven by “madness.”
Back during Newton’s time, stock market navigation, through the estimation of an earnings growth rate and a discount rate to calculate intrinsic value, was not yet established. Therefore, it is unsurprising that Newton was led astray by rampant speculation and animal spirits.
Just as a cloudy night sky hiding Polaris can lead ancient explorers astray, irrational stock market prices can lead investors far from where fundamentals indicate they should be, as determined by earnings growth and interest rates.
That said, two dynamics are occurring in the current market environment that are a cause for concern.
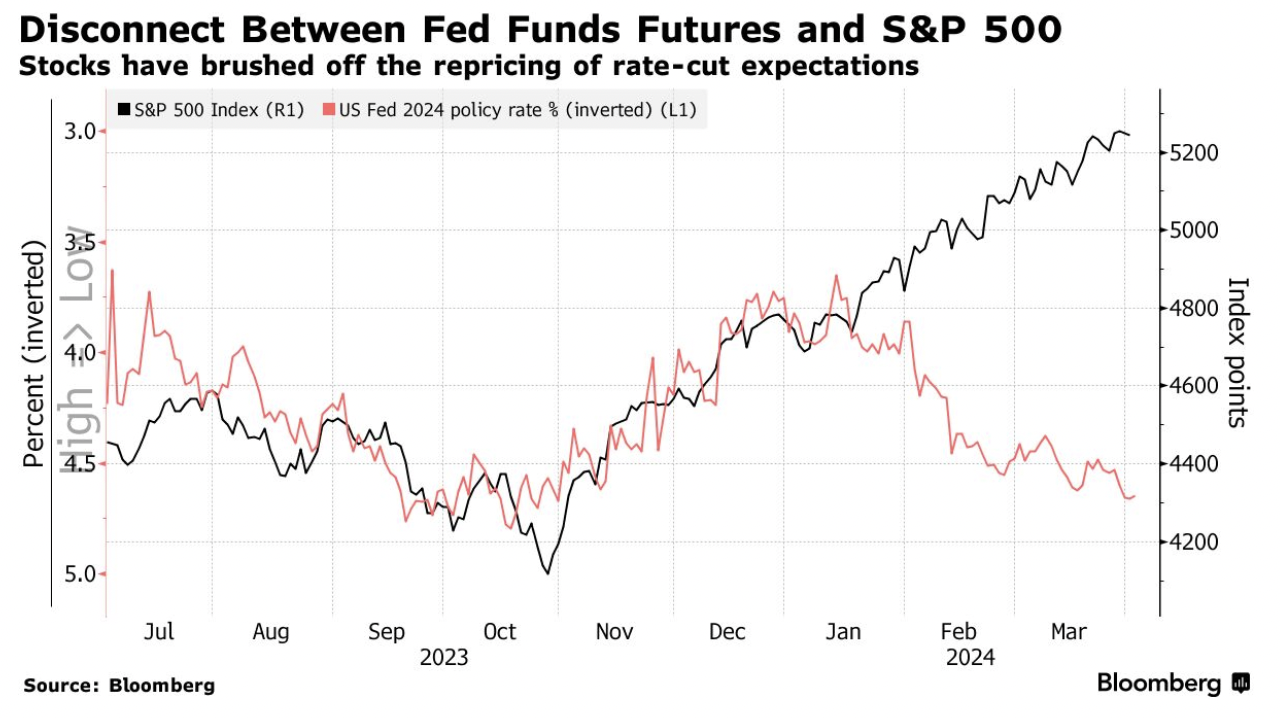
First, while interest rate cut expectations have declined, equity prices have continued to rally.
A loosening of financial conditions has caused a boom in risk assets, markedly lifting the valuations of equities. Nearly 25% of the U.S. equity market is now valued north of 10x revenue, nearing peak levels of 28% in 2021 and 35% at the nadir of the tech bubble in 2000. For U.S. large-cap growth stocks, valuations are well into nosebleed territory.
Based on earnings, the U.S. stock market features a larger percentage of companies trading at higher valuations than at the peak of the tech bubble. There are no ifs, ands, or buts about it – stocks are expensive.
Interest rates act as a financial gravity on asset prices, tethering them to their discounted cash flows, at least theoretically. As rates rise, the present value of future cash flows falls, and as rates fall, the present value of future cash flows increases. In a rational market, prices follow fundamental values.
The short-end on the yield curve is the market’s proxy for the Fed’s interest rate policy. Meanwhile, the long-end of the yield curve represents a forecast on the direction of rates and economic performance. Both have the effect of spurring assets to fall in price when rates rise, and vice versa. However, year-to-date, the 1-year Treasury bill yield has risen from 480 bps to more than 500 bps, while the 10-year Treasury bond yield has jumped from 390 bps to 440bps.
With all else equal, rising rates should lead to lower intrinsic values, with prices expected to follow.
Market participants entered 2024 with the expectation of six to seven rate cuts from the Federal Reserve in 2024, driven by an expected rapid normalization of inflation to 2%, thus supporting a bullish positioning in equities. However, the performance of the global economy, and the U.S. in particular, has continued to beat expectations to the upside, leading to a rapid decline in rate cut expectations.
What was envisioned by bulls to be one of the fastest rate cutting cycles has morphed into higher for longer, with employment remaining strong and consistently beating economist forecasts. Supported by strong economic performance, some Fed members have begun talking down market expectations of three rate cuts this year. What would have been considered shocking mere months ago, the notion of zero rate cuts in 2024, has been recently introduced to the market by more hawkish Fed members.
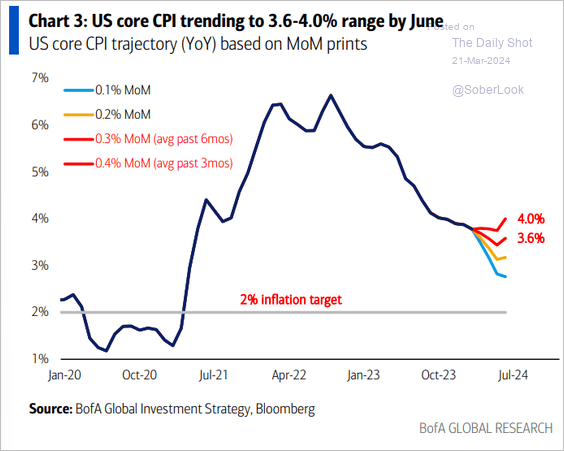
The data fully supports central bankers walking back rate cut expectations. Investors need to look no further than recent trends in inflation to be reminded that the path down to 2% will not be so easy. Recent CPI trajectory supports the higher for longer narrative, and investors should condition themselves for a scenario in which fewer than three, or perhaps even zero, rate cuts occur this year.
Despite unsupportive interest rate trends, all is not lost for stock market bulls. Given that there are two fundamental drivers of intrinsic value, the positive effect of one may more than offset the negative impact of the other. While the rising of, or at least the lack of a decline in, interest rates is negative for asset values, a rise in earnings growth may more than offset the negative effect on intrinsic values due to higher interest rates.
Specifically, rising earnings estimates would buoy valuations, justifying a rally in stocks.
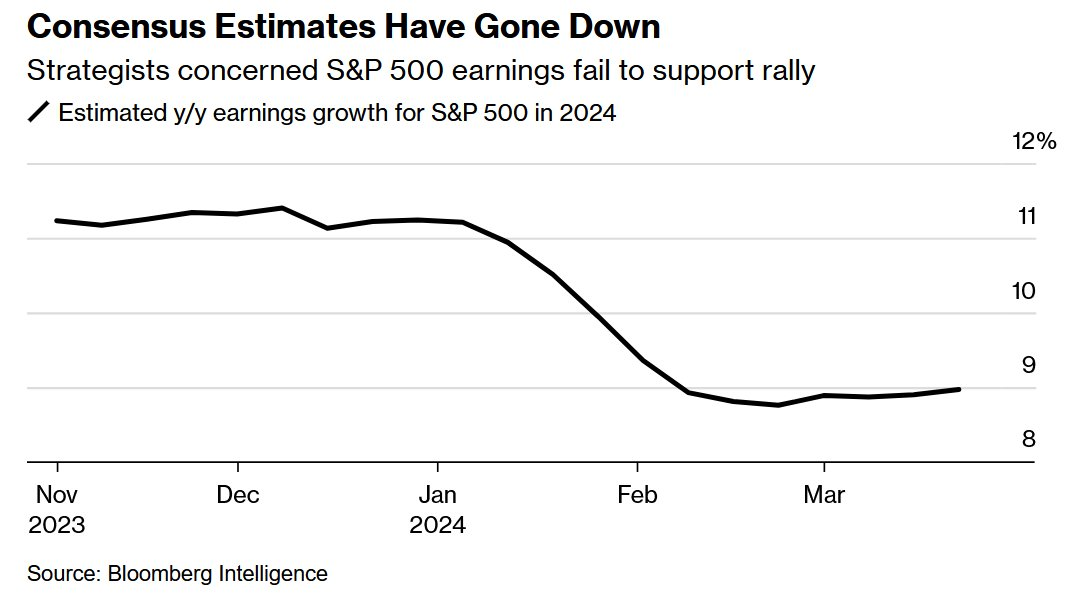
Unfortunately for stock bulls, as it stands, the estimated earnings growth rate of the S&P 500 for 2024 has fallen by more than 200 bps since the start of the year, declining from 11.2% to 9.0%.
Nonetheless, the negatively-trending growth estimate for this year still far exceeds the long-term average earnings growth rate of 5.5% from 1980 to 2020.
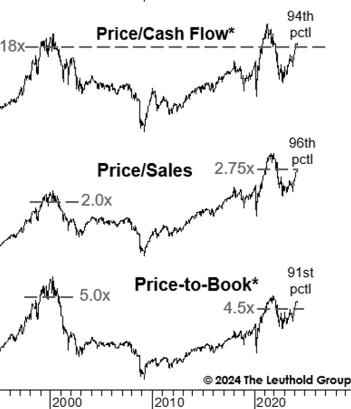
Market participants’ short-hand measure for discounted-cash flow analyses is to utilize valuation multiples. The most common valuation multiples are based on earnings, cash flow, EBITDA, and sales, either trailing or forecast.
While these valuation measures may occasionally deliver conflicting signals regarding the broad stock market’s attractiveness from a valuation perspective, currently, they are all singing in unison. No matter which way you cut it, U.S. large cap growth stocks are exceedingly expensive, with all valuation measures indicating stretched valuations and some even exceeding the levels reached at the peak of the 2000 dot com bubble.
That being said, forecasts are not guaranteed, and for now, the S&P 500 and Nasdaq 100 indexes are reaching new all-time highs seemingly every day. Animal spirits are out in full force, and most investors do not want to miss out on the market spoils that AI will bring. As long as share price charts are up and to the right, who cares about valuations, analysis, or forecasts?
Sentiment drives valuation, and price drives narrative. The prevailing narrative of today’s market is artificial intelligence. And boy, is it ever bullish.
Certainly, AI will change the world, and its influence on both the economy and society will be vast in magnitude. The future of AI is very bright, and the technology is progressing at a break-neck speed.
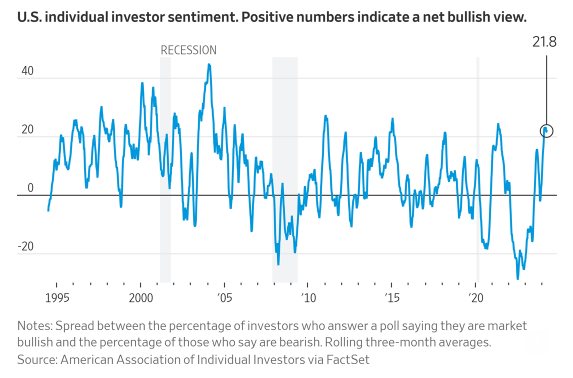
Nonetheless, substantial good news is priced into stocks, with individual investor sentiment reaching new highs for this cycle.
It is not just individual investor sentiment that is stretched thin. Citi’s Levkovich Index, formerly known as its Panic/Euphoria Index, uses 11 different inputs to gauge the prevailing attitudes of market participants. This index just reached the “euphoria” level for the first time this cycle.
Former star mutual fund manager Peter Lynch described his “Cocktail Party Market Indicator”, which pointed to market phases based on the types of conversations ordinary people have about stocks at cocktail parties or social gatherings.
Lynch’s Cocktail Party Market Indicator outlines three stages of market sentiment: pessimism, skepticism, and optimism. In the final stage, everyone at the party has hot stock tips to share (or perhaps hot cryptocurrency tips, reflecting today’s retail-led speculative markets), including the hosts, who might boast about the substantial returns their investments have garnered. This widespread enthusiasm and the fact that stock investing is a popular topic among laypeople often indicates a market top, implying it might be time to sell.
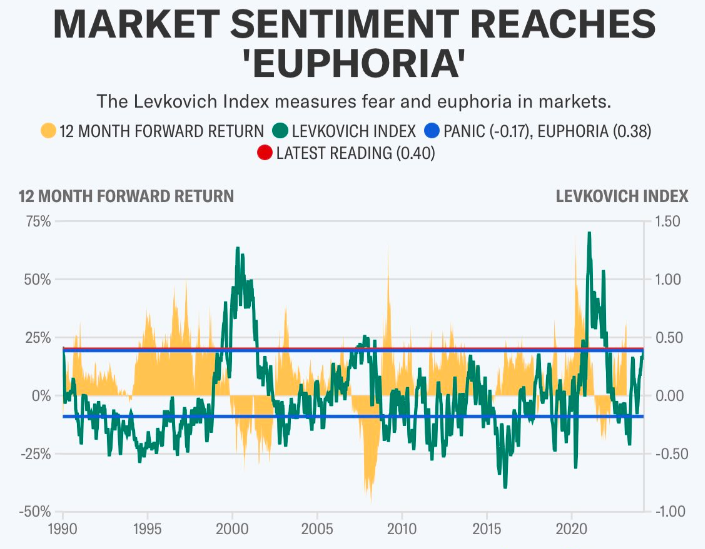
Source: Citi
When taxi drivers start giving you stock tips, the market is likely overheated, and caution is warranted.
In any event, there is no denying that when it comes to U.S. equities, caution has been thrown to the wind, market sentiment is extremely stretched, and valuations are at bubble-like levels.
Look no further than the newly public Trump Media & Technology Group stock, the social media company that is controlled by Donald Trump with the fitting ticker symbol DJT. Despite having only a few million dollars in revenue, Trump Media trades at a nosebleed valuation north of $8 billion. As I recently stated in Bloomberg, “DJT is the mother of all meme stocks,” and its “underlying business fundamentals will matter at some point. The stock can defy gravity for only so long.” Whether DJT’s bubble valuation deflates is to be seen, but the stock is notable as another indicator of market excess.
That said, some will ask, “who cares?” While the debate about whether U.S. equities are in a bubble or not is just semantics, however, there is a rational argument regarding whether investors should care if stocks are in a bubble, and even if they are, should investors do anything about it.
There are two notable points regarding asset bubbles:
First, some asset bubbles never pop, and keep increasing in value. For example, many market prognosticators posited that Canadian residential real estate was in a bubble starting around 2004. There was no doubt that, at the time, prices did appear much higher than fundamental income levels could justify. Twenty years later, Canadian home prices are up 234%, defying the skeptics. As John Maynard Keynes famously observed, markets can stay irrational for longer than one can stay solvent. Some bubbles may never pop. While Canadian housing market bears could be proven correct at some point, we all have finite investment terms, and twenty years represents roughly half the investment lifetime of the typical working adult. Besides, in the investing business, being early is the same as being wrong.
Second, there may be a profitable trading strategy to invest in asset bubbles. Legendary macro hedge fund manager George Soros once stated, “When I see a bubble forming, I rush in to buy, adding fuel to the fire.” While Soros could successfully navigate bubbles profitably, remember, he is the greatest macro trader of all time. If one is to pursue a bubble-chasing strategy, remember that you are playing with fire, and you may get burned.
Despite rapidly falling rate cut expectations, inflation remaining more persistent than expected, interest rates staying higher for longer, and earnings growth forecasts dropping, stocks have elevated to new record highs, and allocators are stuck with a conundrum on investing in a post-fundamental world. They face three potential options:
1. Do nothing and remain fully invested, with no downside hedges, potential bubble be damned. Hope that the stocks further inflate to new all-time high valuations or at least hit “what looks like a permanently high plateau”, as Irving Fisher proclaimed in September of 1929.
2. Hide out in cash and hope for a more rational market in the future.
3. Remain fully invested, while hedging risks with portfolio diversifiers and uncorrelated asset classes that can do well in bear markets, to be prepared for investment success whether or not the bubble bursts.
To me, the answer is obvious. At any rate, wisdom from the Oracle of Omaha may help guide investors as they face exceptional market frothiness and near unprecedented uncertainty in today’s post-fundamental world.
“The less prudence with which others conduct their affairs, the greater the prudence with which we should conduct our own affairs.”
Accelerate manages four alternative ETFs, each with a specific mandate:
- Accelerate Arbitrage Fund (TSX: ARB): Merger Arbitrage
- Accelerate Absolute Return Fund (TSX: HDGE): Beta-Neutral Long Short Equity
- Accelerate OneChoice Alternative Portfolio ETF (TSX: ONEC): Multi-strategy
- Accelerate Canadian Long Short Equity Fund (TSX: ATSX): Directional Long Short Equity
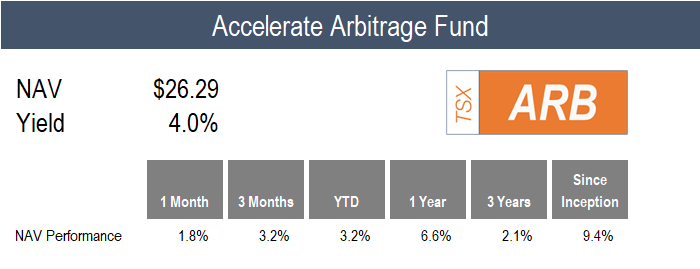
ARB gained 1.8% in March, compared to a 1.0% return for the benchmark S&P Merger Arbitrage Index. Year-to-date, ARB is up 3.2%, while its benchmark has gained 0.8%.
The Fund continues to benefit from upside optionality in merger arbitrage. Specifically, for the second month in a row, a merger consideration was increased above its initial deal due to the actions of an interloper submitting a higher bid. During its go-shop process, Everbridge (the Fund’s largest position) received a higher proposal from a third party, forcing acquiror Thoma Bravo to increase its cash consideration by 22.4%, from $28.60 to $35.00 per share.
While the first two months of the year were incredibly active from an M&A deal flow standpoint, merger announcements slowed in March. ARB added three new merger arbitrage investments over the month (out of nine announced deals), while eight merger investments closed. In addition, the Fund participated in two SPAC IPOs in March, representing 100% of the blank check initial public offerings for the month.
Currently, ARB is 126.8% long, -9.4% short, for a total gross exposure of 136.1%. The Fund is nearly evenly allocated between merger and SPAC arbitrage. Since its inception, ARB has a correlation with equities of 0.13 and a beta to the market of 0.08.
![]()
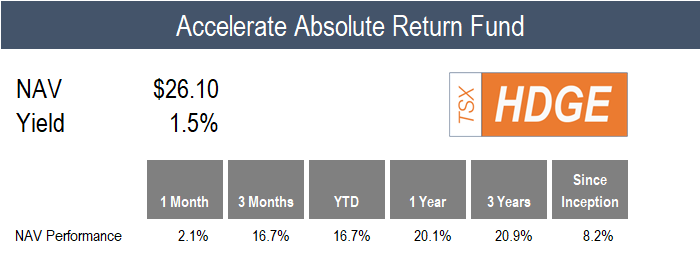
HDGE generated a 2.1% return last month, bringing its year-to-date return to 16.7%.
Multi-factor long-short portfolios had mixed but generally positive performance in March, with the U.S. value, price momentum, operating momentum, and trend portfolios generating single-digit positive performance. The U.S. market neutral quality portfolio was the only significant factor portfolio with a negative return.
Next month, HDGE will reach its 5-year track record, not only with a competitive return profile over both the short and long term, but compelling risk performance metrics, including a since inception correlation with stocks of 0.09 and a beta to the market of 0.09, and a downside participation of -4.5% (a negative downside participation indicates a fund more often than not goes up when stocks go down).
![]()
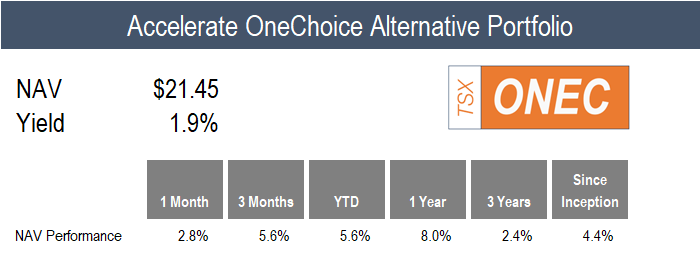
ONEC was up 2.8% in March, a rare month in which all eleven of its alternative allocations generated a positive return.
From the top, gold had the best performance, surging 8.1% as the environment continued to be conducive to the yellow metal. The global macro allocations also performed well, with managed futures rising by 5.6% and risk parity gaining 3.5%.
The real assets allocation, consisting of infrastructure and real estate, contributed positively with returns of 3.9% and 3.2%. ONEC’s absolute return allocations, including beta-neutral long short and arbitrage, added 2.1% and 1.8% to the Fund’s return.
Rounding out the remainder of the portfolio included directional long short equity and commodities, which rose 2.7% and 2.6%, respectively, with the credit portfolio, consisting of leveraged loans and mortgages, contributing with a sub-1% return for the month.
![]()

ATSX generated a 2.7% return for the month, compared to its benchmark, the S&P/TSX 60, which returned 3.7%. Year-to-date, ATSX is up 7.6% versus 6.3% for its benchmark.
Canadian long-short multi-factor performance was negative across the board in March, contributing to the Fund’s underperformance versus the benchmark. Market neutral price momentum and trend fared the worst, dropping -9.4% and -6.1%, respectively, as stocks with poor longer-term momentum and a negative share price trend turned higher, particularly during the last two trading sessions of the month.
Long short value and quality also contributed negatively, as overvalued and low-quality stocks outperformed in the Canadian markets.
Nonetheless, the Fund’s directional structure (long 150 / short 50) enabled it to generate positive performance, albeit trailing the benchmark, during a month in which short selling was challenging.
![]()
Have questions about Accelerate’s investment strategies? Click below to book a call with me:

-Julian
Disclaimer: This distribution does not constitute investment, legal or tax advice. Data provided in this distribution should not be viewed as a recommendation or solicitation of an offer to buy or sell any securities or investment strategies. The information in this distribution is based on current market conditions and may fluctuate and change in the future. No representation or warranty, expressed or implied, is made on behalf of Accelerate Financial Technologies Inc. (“Accelerate”) as to the accuracy or completeness of the information contained herein. Accelerate does not accept any liability for any direct, indirect or consequential loss or damage suffered by any person as a result of relying on all or any part of this research and any liability is expressly disclaimed. Past performance is not indicative of future results. Visit www.AccelerateShares.com for more information.

