


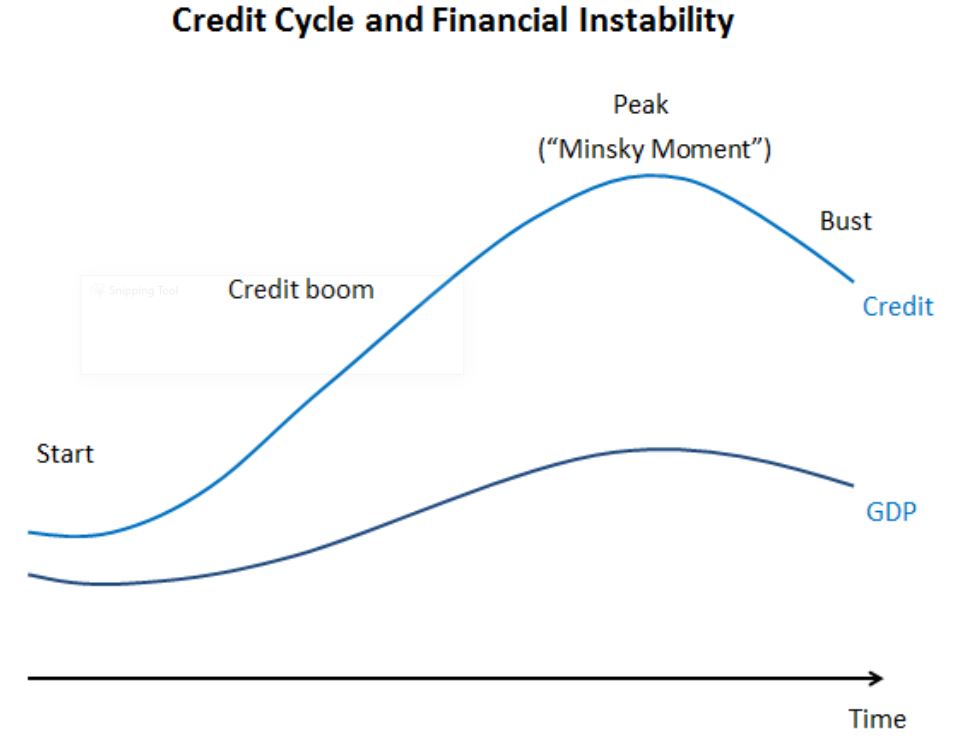
January 14, 2024 – The late, great Hyman Minsky was an influential American economist known for his theories around financial instability and his work on the causes and characteristics of financial meltdowns.
A key figure in post-Keynesian economics, Minsky focused on the inherent instability of financial markets, particularly during periods of economic boom. His most notable contribution, the “Financial Instability Hypothesis,” suggested that long periods of prosperity and bullish markets can lead to excessive risk-taking and speculative borrowing, ultimately resulting in a financial crisis. His hypothesis gained widespread recognition during and after the 2007–2008 financial crisis, epitomizing what is now commonly referred to as a “Minsky Moment.”
A Minsky Moment describes a sudden market collapse that follows a long period of bullish or speculative market activity. It occurs when overleveraged market participants begin selling off assets to meet repayment demands and margin calls. This selling causes prices to drop, leading to a market crash or a severe credit crunch.
After the 2022 equity bear market, the stock market rebounded in 2023, with the S&P 500 generating a total return of more than 26%. Throughout the year, bonds were under pressure as the 10-year Treasury yield rose until peaking at 5% before making a smooth ride down to 4%, perhaps ending the 3-year bond bear market.
Equities enjoyed buoyant returns despite only a modest improvement in fundamentals. Specifically, the U.S. benchmark experienced its best year since 2019 powered by a modest 5.2% growth in real (inflation-adjusted) earnings.
As such, the vast majority of the positive stock market performance last year was due to multiple expansion, or increasing positive sentiment. After November’s plunge in bond yields and subsequent surge in both bonds and stocks, the FOMC projections of mid-December, which called for three rate cuts in 2024, put investors over the edge.
In December, after presumably getting the green light from Fed Chair Jay Powell, stock market participants pushed their chips all-in and went full tilt into stocks. The S&P 500 ETF experienced its greatest monthly inflow of all time.
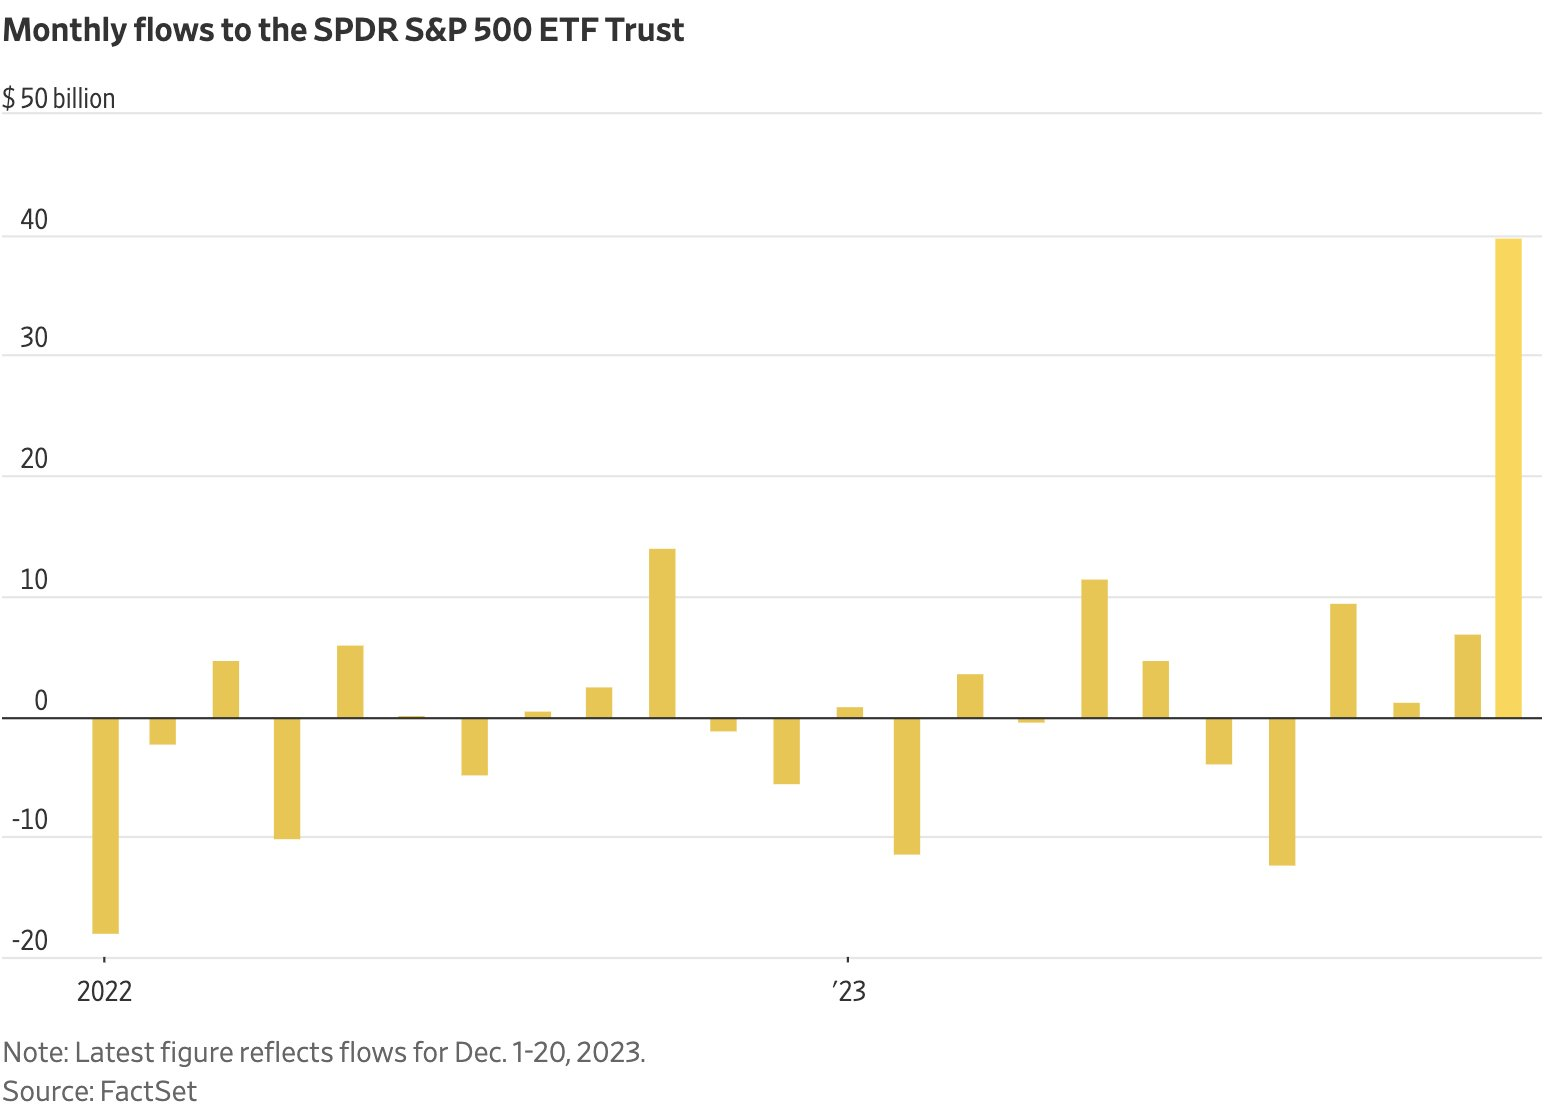
Record fund inflows imply extreme bullish sentiment. It does not happen at the bottom. Accordingly, last year ended with the Fear and Greed Index firmly in the “Extreme Greed” camp.
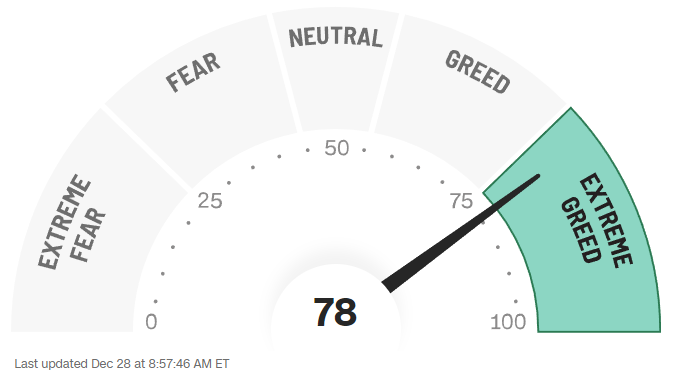
After the surge in risk assets between last Halloween and Christmas, it is unsurprising to see equities taking a breather. Stretched bullish sentiment, combined with a market consensus forecast of an aggressive interest rate-cutting cycle, has left equities vulnerable to a correction.
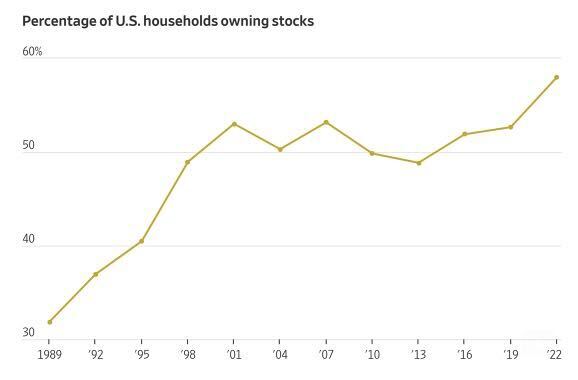
With record inflows into stocks and all-time-high household stock ownership, it is worthwhile to consider – who is left to buy pricey U.S. equities?
The S&P 500 trades at 24.7x trailing GAAP earnings, or 22.4x trailing “operating” earnings. Looking forward, the benchmark U.S. equity index is trading at 21.7x earnings and 19.7x adjusted earnings based on 2024 forecasts. Consensus estimates call for 13% to 14% nominal earnings growth, nearly double the historical S&P 500 earnings growth rate.
Assuming a 10-year yield of 4.0% and a 300 bps equity risk premium implies an earnings yield of 7.0%, translating to a market multiple of 14.3x. Applying this “fair” market multiple to this year’s lofty adjusted earnings gets us to 3464 for the S&P 500, for a drawdown of -28% (excluding dividends), the logical conclusion of the current potential Minsky Moment.
In addition, historically, S&P 500 earnings estimates have been far too high and have drifted -5% to -10% lower throughout the year, on average. Assuming this does not occur and earnings estimates hold up, the only way the S&P 500 goes up this year is if the equity risk premium stays at 0% or goes negative.
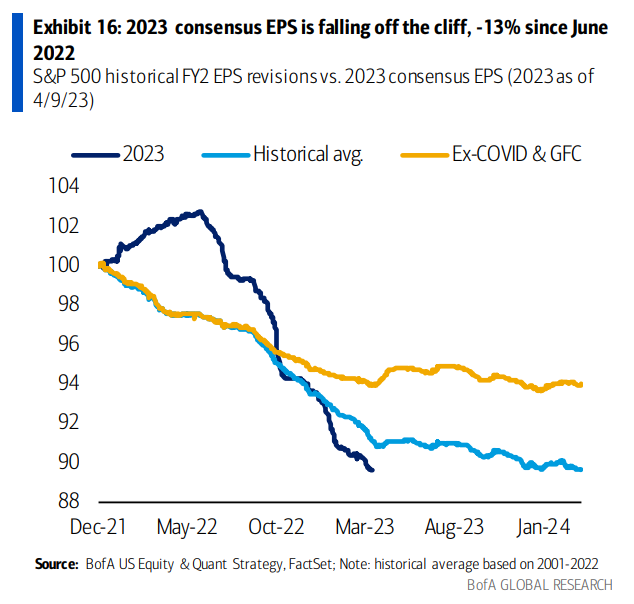
Declining equity earnings estimates in line with the historical average would increase the valuation risk that investors currently face.
However, high equity valuations are not consistent around the globe. In certain jurisdictions, allocators can find more attractive equity valuations and higher earnings yields.
“American exceptionalism” applies to not only ideals of democracy and personal freedom. Given the outstanding recent outperformance of U.S. equities compared to pretty much any other stock market around the world, it is worthwhile to ask how much longer American Exceptionalism in the stock market can last.

The S&P 500’s outperformance over its international brethren over the past several years has left it vulnerable to future underperformance. Sectors and regions within equities are historically mean-reverting. As they say, no trees grow to the sky.
In any event, investors tend to prefer to stick with what has been working best recently, and flows tend to chase performance. And nowhere else has offered the premier recent performance as the Standard and Poor Index Committee’s selection of 500 U.S.-listed large-cap growth stocks. We increasingly hear calls to own what has been performing best recently and therefore allocate one’s entire portfolio solely to the S&P 500, diversification (and valuation concerns) be damned. Remember, U.S. equities only represent 26% of the global market portfolio.
However, it was not always this way. American exceptionalism in equities is only a recent phenomenon.
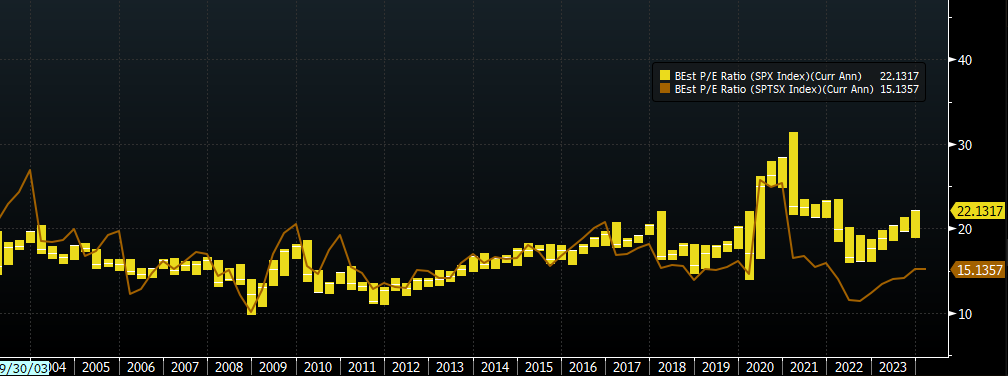
Prior to 2020, the S&P 500 and Canada’s benchmark, the TSX Composite, traded at equivalent valuations (generally 12x – 18x earnings). Post-COVID, a gap has emerged. While the TSX continues to trade at its average historical valuation of 15x earnings, the S&P 500 now trades at a premium 22x multiple.
Source: Bloomberg
A similar dichotomy can be seen between the S&P 500 and the All Country World Index ex-US. Ten years ago, U.S. stocks traded at a 3-turn premium to international equities. Now, that premium has grown from a 3 to a 7-turn premium. International equities now offer a 260 bps earnings yield above the S&P 500.

Source: Bloomberg
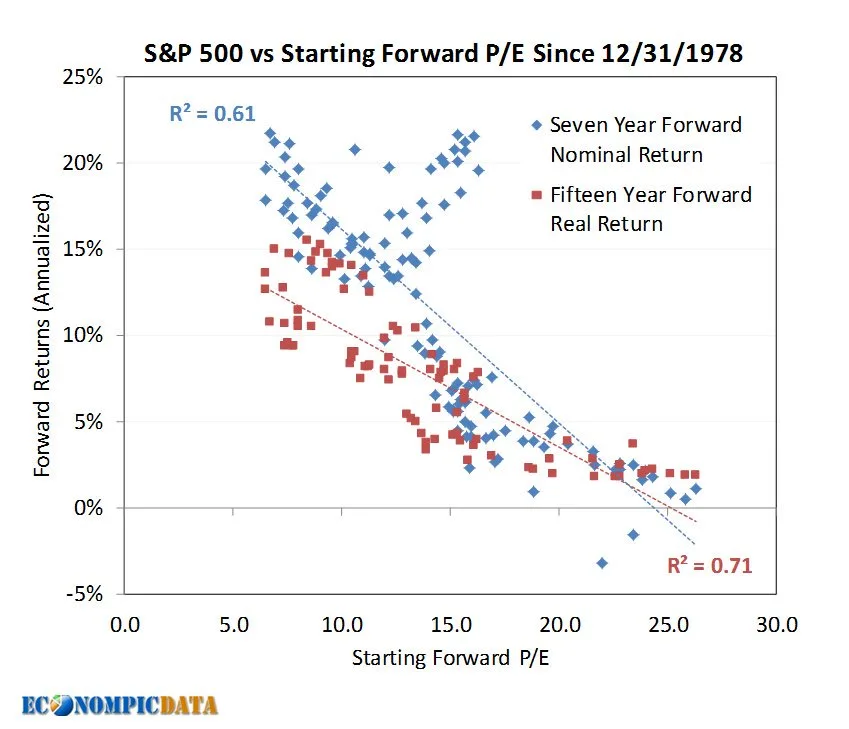
Over the long term, valuations drive returns. Intuitively, this makes sense, as a higher earnings yield (inverse P/E ratio) should generate a better return than a lower earnings yield, on average.
Looking at historical returns from the past 45 years, the S&P 500 has not had an annual return north of 5% when starting from an earnings multiple above 20x (where we are now).
Perhaps this time is different. In any event, it is the start of a new year, and forecasts abound despite their lousy track record.
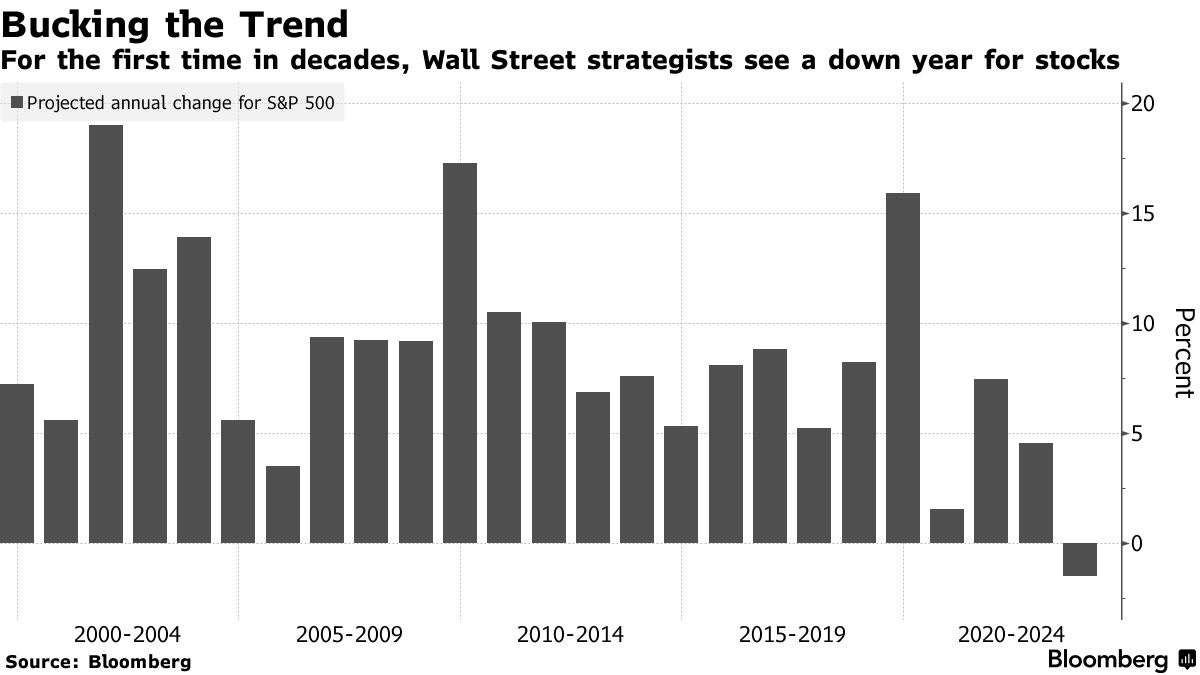
For example, coming into 2023, predictions of a recession were rampant, with the average Wall Street strategist predicting a down year for stocks.
Contrary to these gloomy forecasts, inflation kept declining, consumer spending remained robust, and the unemployment rate dropped to its lowest since 1969 at 3.4%. However, as the year drew to a close, a wave of optimism surged when the Federal Reserve hinted at a potential shift towards cutting interest rates rather than increasing them. This wink and nod from the Fed sparked an “everything rally,” boosting the value of most asset classes, from gold and bitcoin to high-risk corporate bonds and small-cap stocks. Remarkably, the S&P 500 concluded the year with a stunning nine-week streak of gains, its most extended period of consecutive weekly rises in almost two decades.
Even the Fed gets it wrong. Two years ago, the FOMC’s “dot plot” called for a fed funds rate of approximately 1.6% at year-end 2023. It ended up literally off the chart at 5.3%.

Remember, no one knows nuthin’, so fortify your investment portfolio to do well in all environments.
Our forecast for 2024 is that a diversified investment portfolio comprising ten uncorrelated asset classes will provide the best risk-adjusted returns.
Accelerate manages four alternative ETFs, each with a specific mandate:
- Accelerate Arbitrage Fund (TSX: ARB): Cash Plus
- Accelerate Absolute Return Hedge Fund (TSX: HDGE): Portfolio Protector
- Accelerate OneChoice Alternative Portfolio ETF (TSX: ONEC): Portfolio Stabilizer
- Accelerate Enhanced Canadian Benchmark Alternative Fund (TSX: ATSX): Canadian 150/50
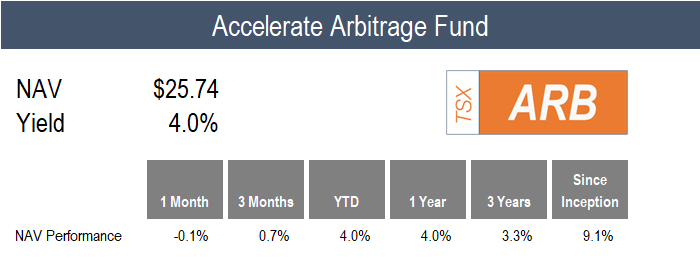
December was uneventful for ARB, as the Fund experienced a relatively flat month. For 2023, ARB generated a 4.0% return. While the year’s return was below our high-single-digit return target, the return profile was characterized by low volatility. The Fund’s worst monthly drawdown was -0.6% in October, and its annual volatility was approximately 1.0%.
While the variability of the Fund’s return stream throughout the year was very muted, certain arbitrage investments made managing the Fund anything but boring. Whether it be the AMC / APE dual share class arbitrage, the Activision / Microsoft merger arbitrage, or the VMWare / Broadcom merger arbitrage, the underlying portfolio was filled with drama and excitement. Nonetheless, the two primary considerations attributed to the low-risk returns of the Fund were diversification and staying away from blow-ups, of which there were several in the space throughout the year.
Nonetheless, ARB enters 2024 with a fully deployed and attractively positioned portfolio. The Fund is 136.0% long and -12.7% short (for 148.8% gross exposure), with 70% allocated to SPAC arbitrage and 30% to merger arbitrage. The weighted average portfolio yield of the Fund sits at more than 8.0%.
The opportunity set in arbitrage remains significant and dynamic. M&A activity remains robust, with 74 public mergers outstanding representing a total deal value of $415 billion. While the SPAC market has shrunk to $15 billion across 254 issues, there remains a small but steady stream of new issuance to capitalize on, in addition to opportunities in the secondary market.
Throughout 2023, ARB was consistently ranked in the top 10 global arbitrage funds according to hedge fund data platform BarclayHedge. Also, ARB was shortlisted for “Best Merger Arbitrage” at the HFM US Hedge Fund Performance Awards, putting the Fund in the top six in its category (and the only Canadian fund to gain recognition).
![]()
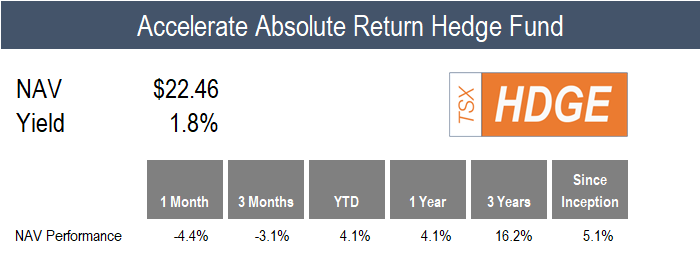
December was a challenging month for alternative risk premia and long-short multifactor investing. The price momentum and trend portfolios took the brunt of the damage, while value and quality declined by a lesser amount, and operating momentum was flat. These market conditions caused long-short and market-neutral hedge funds to suffer in December. A portfolio that was long the Goldman Sachs Hedge Fund VIP basket and short the Goldman Sachs Most Shorted basket (a proxy for equity market neutral) lost -14.2%.
In any event, the “Bad Santa” junk stock rally into year-end has subsided, with much of the move reversed over the first two weeks of 2024.
Since its inception nearly five years ago, HDGE has maintained a correlation to stocks of 0.08 and a correlation to bonds of -0.09.
![]()
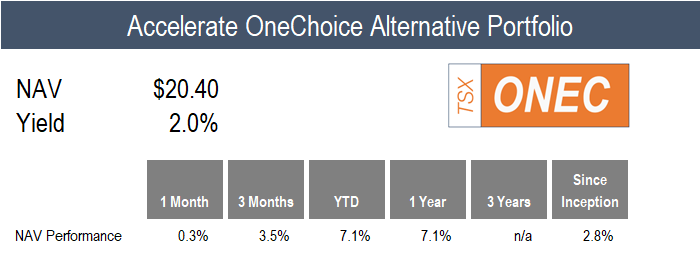
ONEC ticked up 0.3% in December, with roughly half of its alternative allocations generating positive returns, and the other half negative.
Starting on the positive side of the ledger, risk parity surged 6.6%, and Canadian long-short gained 2.9%. The credit allocations performed well, with leveraged loans generating a 1.8% return and the mortgage portfolio returning 2.6%.
As risk assets rallied during the month, real assets also gained, with real estate rallying 5.5% and infrastructure increasing by 2.0%.
The inflation protection basket had mixed results, with the precious metals allocation gaining 1.3% and commodities declining by -2.5%.
Several uncorrelated hedge fund strategies fell in December, as arbitrage ticked lower by -0.1%, while managed futures and absolute return fell by -3.0% and -4.4%, respectively.
ONEC maintains a highly diversified portfolio, with allocations to six alternative asset classes and eleven alternative strategies.
![]()

ATSX gained 2.9% for the month, while its benchmark, the TSX 60, rallied by 4.1%. The Fund’s 50 long / 50 short overlay portfolio generated a -1.2% loss.
Canadian multifactor long-short performance was negative in aggregate, although the underlying drivers were mixed. Long-short value and quality were flat in December while operating momentum generated a positive return for the portfolio. Market-neutral price momentum and trend portfolios suffered from the challenging conditions, dropping by -7.6% and -7.8%, respectively.
![]()
Have questions about Accelerate’s investment strategies? Click below to book a call with me:

Disclaimer: This distribution does not constitute investment, legal or tax advice. Data provided in this distribution should not be viewed as a recommendation or solicitation of an offer to buy or sell any securities or investment strategies. The information in this distribution is based on current market conditions and may fluctuate and change in the future. No representation or warranty, expressed or implied, is made on behalf of Accelerate Financial Technologies Inc. (“Accelerate”) as to the accuracy or completeness of the information contained herein. Accelerate does not accept any liability for any direct, indirect or consequential loss or damage suffered by any person as a result of relying on all or any part of this research and any liability is expressly disclaimed. Past performance is not indicative of future results. Visit www.AccelerateShares.com for more information.

