
February 21, 2026 – The roots of quality investing predate modern quantitative finance. In their ground-breaking 1934 book Security Analysis, investment legends Benjamin Graham and David Dodd emphasized not only cheap valuations (hence their status as the fathers of value investing), but also investment quality metrics such as high margins and earnings stability.
Ben Graham’s acolyte, Warren Buffett, continued to refine their approach. While he primarily focused on value investing (what he called “cigar butts”) and merger arbitrage, Buffett increasingly included quality metrics such as high returns on capital and economic moats in his investment selection.
Decades later, modern quantitative finance emerged in 1993 with the seminal paper, Common Risk Factors in the Returns on Stocks and Bonds, published by Eugene Fama and Kenneth French in the Journal of Financial Economics. The research paper detailed a three-factor model based on market (beta), size (small minus big), and value (high minus low) to explain stock returns. While used by more discretionary practitioners, quality was not yet a formal factor.
The first academic paper on the quality factor (also known as the profitability factor) was written by American finance economist Robert Novy-Marx in 2013. In the breakthrough research study, The other side of value: The gross profitability premium, Novy-Marx discovered that the profitability factor, gross profits-to-assets, “has roughly the same power as book-to-market predicting the cross section of average returns”. He continued, “profitable firms generate significantly higher returns than unprofitable firms, despite having significantly higher valuation ratios.” Analyzing securities returns between 1963 and 2010, he discovered that the most profitable firms (highest gross profits-to-assets quintile) outperformed the least profitable firms (lowest quintile) by nearly 4% per year.
Up until that time, value was arguably the most popular quantitative factor in systematic investing, followed by the momentum factor, as first detailed in Narasimhan Jegadeesh and Sheridan Titman’s highly influential 1993 research paper, Returns to Buying Winners and Selling Losers: Implications for Stock Market Efficiency.
Novy-Marx’s research on quality, which demonstrated that high-profitability firms outperform low-profitability firms, was notable because it showed that gross profitability predicted returns as strongly as valuation. The quality factor return premium was robust internationally and even worked when controlling for value and size.
His key insight was that quality, or profitability, provides a premium return similar to value, indicating that high profitability stocks earn excess returns.
Since then, quality factors have expanded far beyond Novy-Marx’s gross profits-to-assets. The quality factor now includes a myriad of additional metrics such as return on equity, return on assets, return on capital, return on invested capital, accruals, earnings stability, capital discipline, leverage, and more.
While quality factor investing has proven itself effective over the long run, it does go on stretches of underperformance. In particular, 2025 was one of those years when quality investing proved ineffective, and many began to question its continued relevance.
In North America, low-quality stocks surged by 25.8% in 2025, while high-quality stocks gained just 7.3%. A long-short equity strategy based on the quality factor (long high-quality and short low-quality) would have lost -18.5% last year. This result was far off the average approximate 4% outperformance of high-quality stocks over low-quality stocks in the 47 years before 2010.
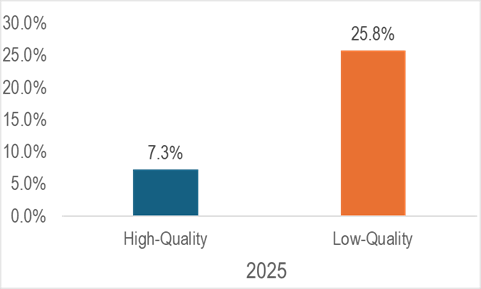
Source: Accelerate
One of the key drivers behind the poor performance of the quality factor last year was the emergence of several sector bubbles, particularly in quantum computing, nuclear, and crypto stocks. As a group, these stocks ranked poorly across nearly all quality metrics, yet many of these companies posted outstanding stock market returns last year.
Nevertheless, extending Novy-Marx’s research from 2010 to the present day, and expanding his set of quality factors beyond gross profits-to-assets, shows that quality investing works over the long term even including a disastrous year like 2025.
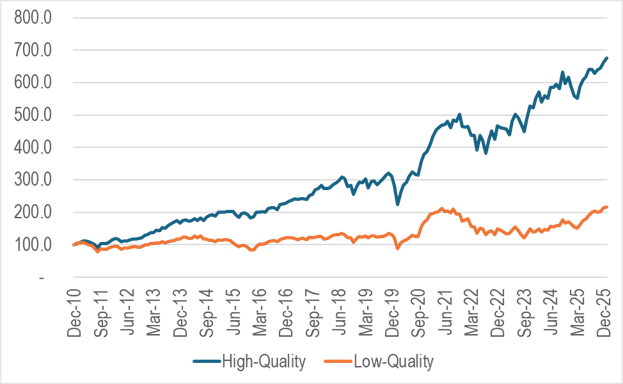
Over the past 15 years, North American high-quality stocks have gained 13.4% per annum, while low-quality securities increased just 5.2%, for a quality factor spread or premium of 8.2% per year.
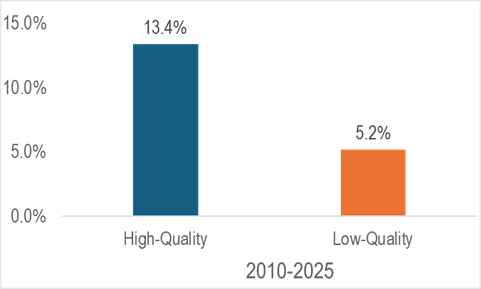
Source: Accelerate
$100 invested in the high-quality basket would have grown to nearly $700 since 2010. Meanwhile, $100 invested in the low-quality basket grew to just over $200.
Source: Accelerate
Despite a challenging 2025 for the quality factor, updating Novy-Marx’s research from 2010 to the present out-of-sample indicates that quality investing is still an effective strategy. Data indicates that this trend continues into 2026, with the high-quality basket gaining 2.2% in January while the low-quality portfolio lost -1.2%.
Given the effectiveness and predictive power of the quality factor, which only improves when combined with other robust systematic factors into a multi-factor approach, investors may benefit from utilizing factor rankings when selecting securities in which to go long or short. To help facilitate idea generation, we highlight one top-decile stock that is forecasted to outperform and one bottom-decile stock that is predicted to underperform in this month’s AlphaRank Top Stocks.
OUTPERFORM: Toromont Industries Ltd (TSX: TIH) is a major Canadian industrial and equipment-services company. It serves a wide range of essential industries by providing specialized capital equipment and lifetime product support – from construction and mining to infrastructure and refrigeration systems. Toromont is one of Canada’s largest authorized dealers of Caterpillar equipment, selling, renting, and servicing a comprehensive line of mobile and stationary machines used in construction, mining, road building, forestry, waste management, power generation, and more. The company’s 23.4% return on capital ranks it high on the quality scale. In addition, its positive operating momentum, as evidenced by beating quarterly expectations and rising earnings estimates, supports the case for additional share price appreciation. With positive share price momentum, along with an AlphaRank score of 99.5/100, we expect TIH shares to continue to outperform. Disclosure: Long TIH shares in the Accelerate Canadian Long Short Equity Fund.
UNDERPERFORM: Nuscale Power Corp (NYSE: SMR), a bastion of the 2025 low-quality nuclear stock bubble, is a U.S.-based nuclear technology and small modular reactor developer. Its business model is to design and sell standardized, factory-built nuclear reactors that are smaller and easier to deploy than conventional nuclear plants. SMR ranks poorly on profitability, with deeply negative operating margins. The company continues to burn cash with revenues very low relative to expenses. Without a clear path to profitability or material revenue growth, continued dilution (issuing shares to raise cash) could weigh on the stock. Its high beta and negative share price momentum are supportive of further share price deterioration. With an AlphaRank score of 0.2/100, we expect SMR shares to continue to underperform.
The AlphaRank Top and Bottom stock portfolios exhibited positive relative performance last month:
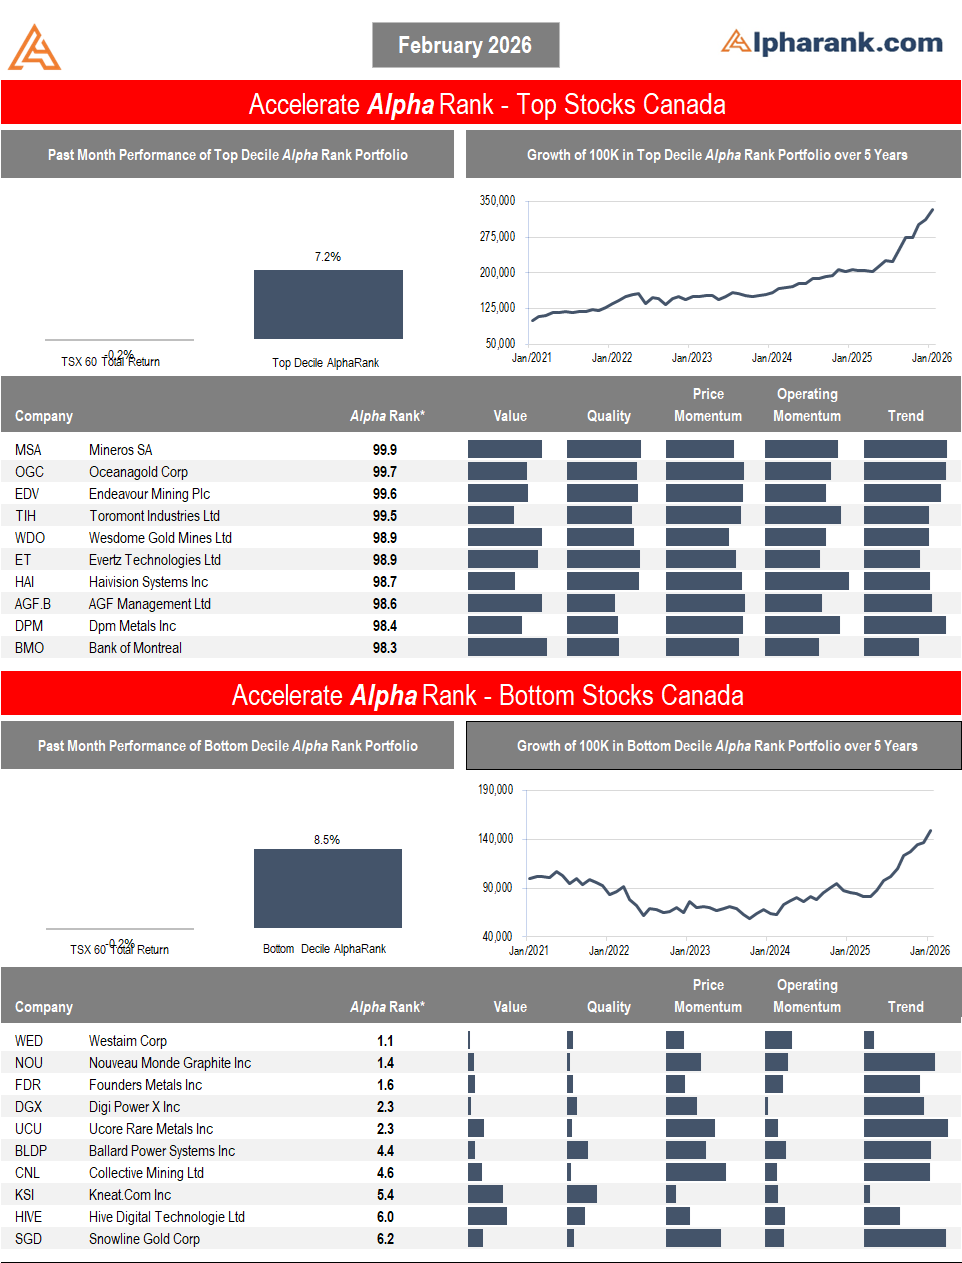
- In Canada, the top-ranked AlphaRank portfolio of stocks gained 7.2%, outperforming the benchmark’s -0.2% decline, while the bottom-ranked portfolio of Canadian equities jumped 8.5%. The long-short portfolio (top minus bottom-ranked stocks) declined by -1.3%, as the bottom-ranked stocks outperformed the top-ranked securities. Over the past five years, the top decile AlphaRank portfolio has gained nearly 250%, while the bottom-ranked portfolio has risen approximately 50%.
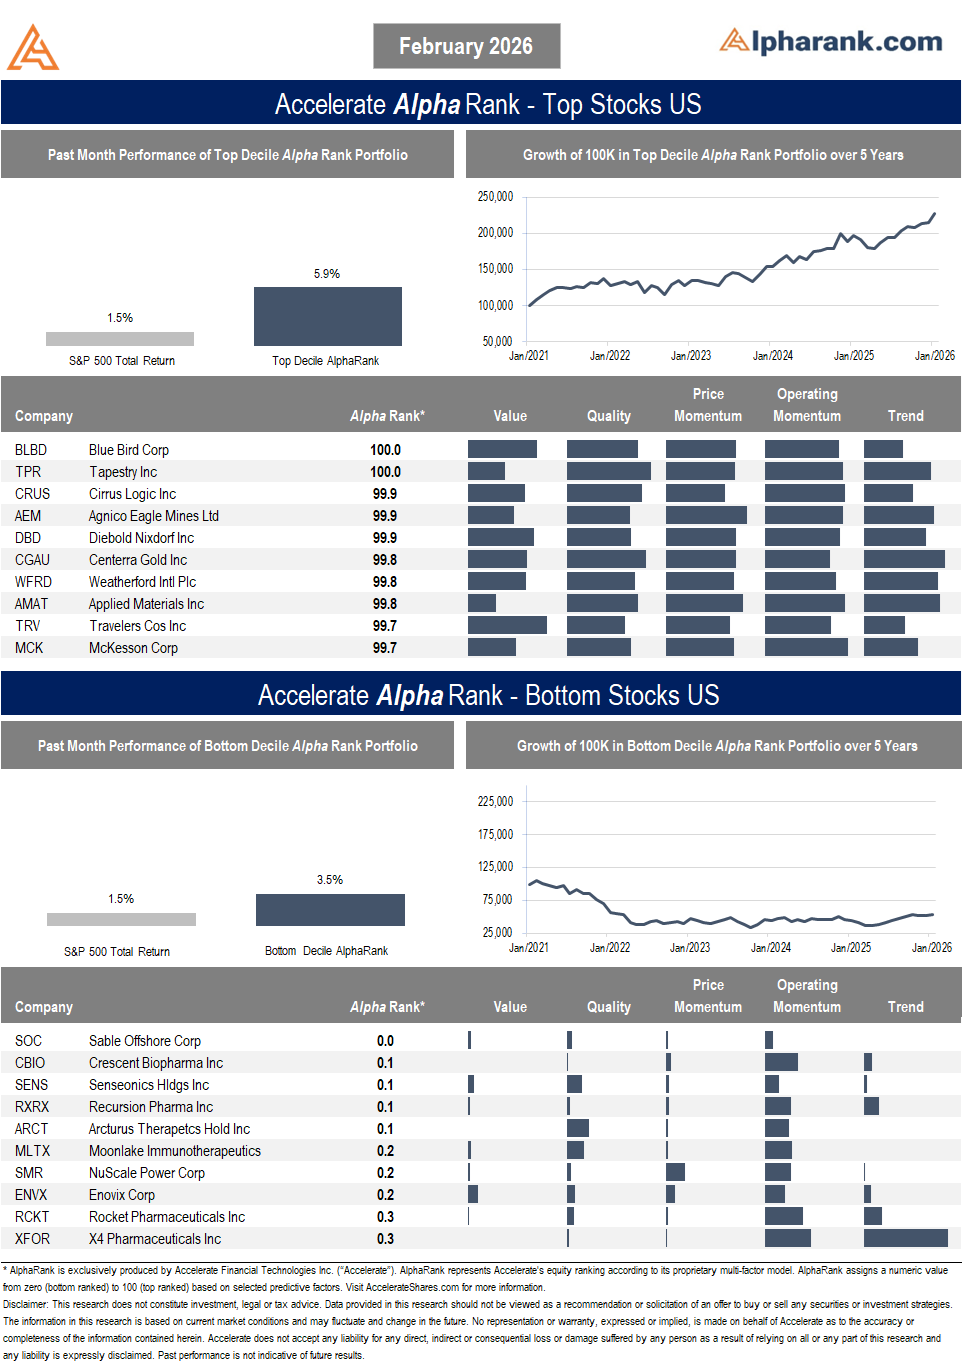
- In the U.S., the top-decile-ranked equities rose by 5.9%, outperforming the S&P 500’s 1.5% return. Meanwhile, the bottom-ranked stocks increased by 3.5%, resulting in a 2.4% return for the top decile minus the bottom decile long-short portfolio. Over the past five years, the top-ranked U.S. equities have gained nearly 140%, while the bottom-ranked portfolio has declined by approximately -50%.
AlphaRank Top Stocks represents Accelerate’s predictive equity ranking powered by proven drivers of return. Stocks with the highest AlphaRank are projected to outperform, while stocks with the lowest AlphaRank are anticipated to underperform. AlphaRank assigns a numeric value to each security, ranging from 0 (bottom-ranked) to 100 (top-ranked), based on selected predictive factors. All Canadian and U.S. stocks priced above $1.50 per share and with a market capitalization exceeding $100 million are evaluated. In both the Accelerate Absolute Return Fund (TSX: HDGE) and the Accelerate Canadian Long Short Equity Fund (TSX: ATSX), Accelerate funds may be long many top-ranked stocks and short many bottom-ranked stocks. See AccelerateShares.com for more information.