


April 4, 2026 – Liquidity is defined as the ease and speed with which an asset can be converted into cash at or near its current value without materially impacting its price.
As an asset class, private credit is inherently illiquid. Loans are typically directly originated, not broadly traded, and often have limited secondary markets. As a result, private credit funds that raise capital from investors should offer redemption terms that align with the underlying liquidity of the fund’s assets.
An asset-liability mismatch occurs when the liquidity of an asset does not align with its funding obligation. Just because an asset is illiquid does not make it inherently problematic. Only when an asset-liability-mismatch occurs do problems arise – the classic case being a bank run. Another example would be a fund that offers frequent redemptions (short-term liabilities) but holds long-duration, illiquid loans (long-term assets).
Private credit funds are typically structured as Business Development Companies (BDCs), which generally come in two flavours: listed (publicly-traded) and non-traded.
The liquidity behind publicly-traded BDCs is straightforward. These private credit vehicles trade as closed-end funds on the NYSE and NASDAQ exchanges, allowing investors to buy and sell at the quoted market price. Note that this market price can vary widely from the underlying fund’s net asset value (NAV).
In contrast, non-traded BDCs, as their name implies, do not trade on an exchange. Generally, investors can subscribe to the fund at NAV on a periodic basis (e.g. monthly). For exit liquidity, non-traded BDCs typically provide a quarterly tender offer for up to 5% of the fund’s shares outstanding. If less than 5% of shares are tendered for redemption in a given quarter, all will be paid out at NAV. If greater than 5% are tendered, then redemptions will be prorated. For example, if 10% of shares are tendered into the quarterly 5% tender offer, investors will be prorated by 50% – they will only get half of their requested capital back, with the rest remaining in the fund. Given the illiquidity of the private loans that they invest in, non-traded BDCs do not offer the same redemption terms as an open-ended fund such as a mutual fund. Note that the 5% quarterly tender and prorating mechanism differs from fund gating, which is when a fund temporarily limits or suspends investor withdrawals to prevent forced selling of assets.
While the traditional, publicly-traded BDCs have grown slowly and have existed for decades, non-traded BDCs are a more recent phenomenon. Emerging only a handful of years ago, they have grown in assets incredibly quickly.
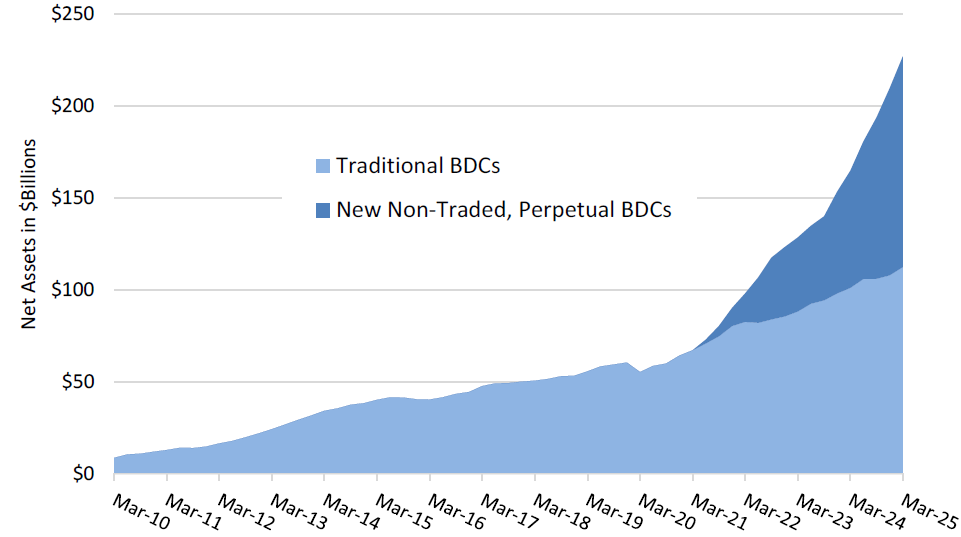
Source: Cliffwater
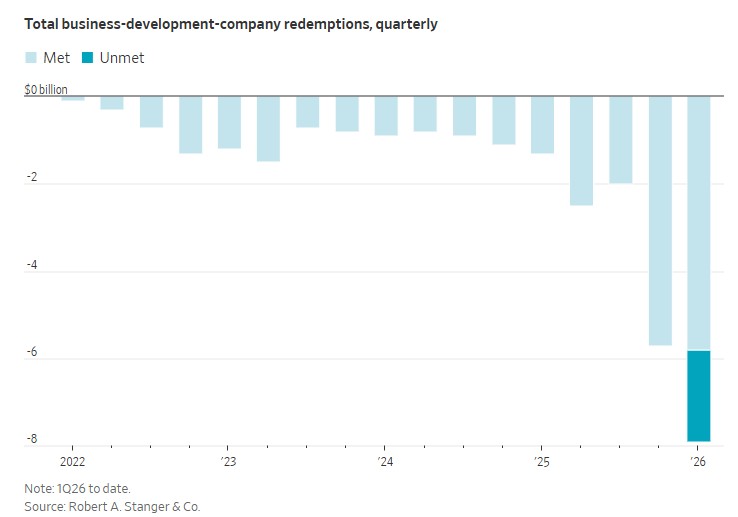
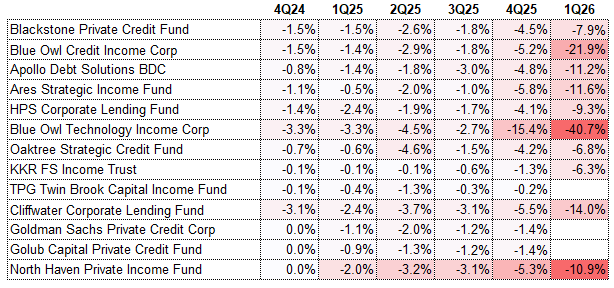
Non-traded BDCs were heavily favoured by investors from 2022 to 2025, investing hundreds of millions of dollars. However, due to a dramatic change in sentiment toward the asset class, investor redemption requests have recently surged. This quarter to date, investors have requested nearly $8 billion from non-traded BDCs (from total net asset values of non-traded BDCs of more than $150 billion).
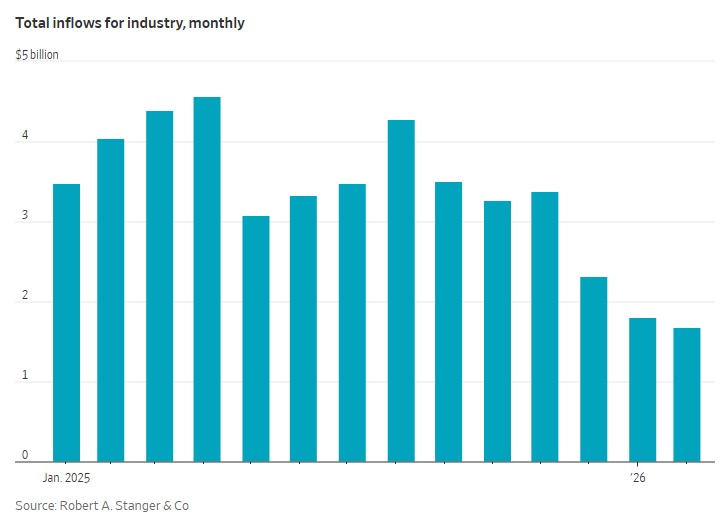
In contrast, inflows into non-traded BDCs have slowed markedly, falling to below $2 billion per month earlier this year, compared with more than $4 billion per month in early 2025.
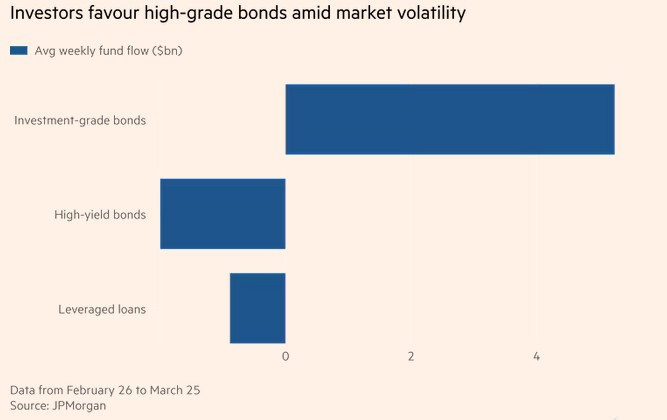
That said, investors are fleeing from not only private credit. The other main segments of sub-investment grade credit, high-yield bonds and leveraged loans, have also experienced material outflows recently.
U.S. junk bond funds have suffered $2 billion per week of outflows over the past month, a more than 20x increase from the four weeks prior. Leveraged loan funds saw nearly $1 billion of weekly outflows over the same period, compared to inflows of $247 million in the prior month. There is a flight to safety in credit occuring, with more than $5 billion moving to investment-grade bonds.
Despite the outflows from all of the three major segments of sub-investment grade credit, it is private credit that has received the most scrutiny and media attention.
One major reason why private credit has received the brunt of the negative attention is around redemptions. If investors in leveraged loan or high-yield bond funds want their capital back, the fund manager sells these liquid assets and returns the investor’s capital. In contrast, private credit funds hold illiquid assets that generally do not trade. Therefore, the redemption mechanics are more complex and are resolved via a 5% quarterly tender offer. As investors in many non-traded BDCs have recently requested redemptions above the 5% offer cap, negative headlines have emerged, and the larger the redemption request, the gloomier the headline. Moreover, non-traded BDC redemptions are somewhat of a negative feedback loop, as rising redemption requests beget negative media headlines, which beget more redemption requests.
Source: @NicoGladia
One high-profile firm that has likely received the most negative attention is Blue Owl Capital. In addition to a recently terminated non-traded BDC merger and a large private loan portfolio sale, the firm’s non-traded BDCs have attracted attention due to elevated redemption requests this quarter. In particular, its Blue Owl Credit Income fund saw redemption requests of 21.9%, while its Blue Owl Technology Income fund received redemption requests for 40.7%.
These are big, scary numbers, and it is easy to see how these headline figures could spark fear in investors.
But is it all gloom and doom?
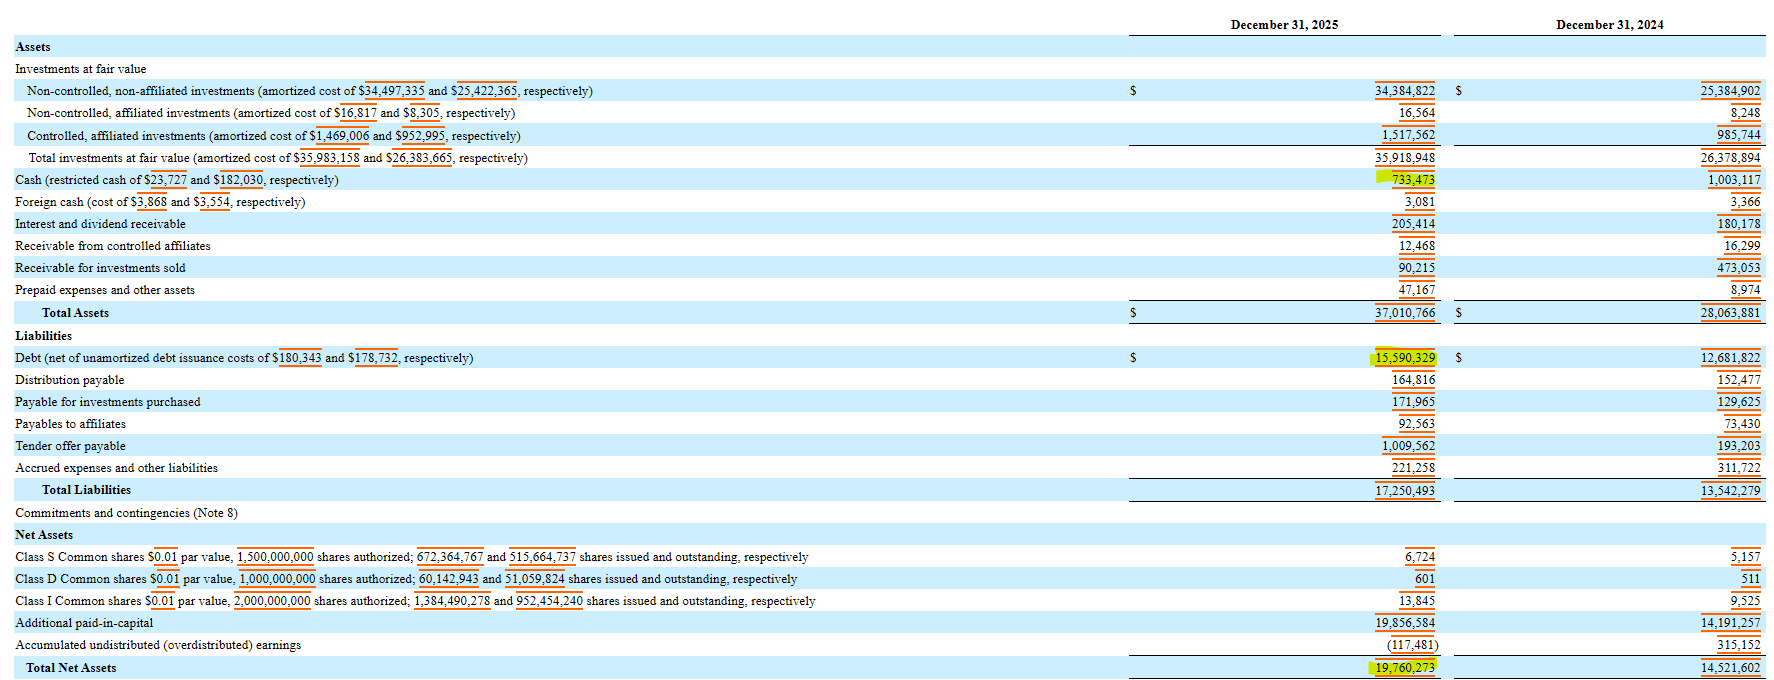
We will use the Blue Owl Credit Income fund (OCIC) as a case study to analyze. It is the second largest non-traded BDC, with total assets of $37.0 billion and net assets of $19.8 billion, as of year end 2025. In addition, it has experienced one of the highest rates of redemption requests.
This quarter, OCIC received redemption requests for 21.9% of the fund. While redemption requests for more than one-fifth or a private credit fund holding illiquid assets is cause for concern, there are several reasons why the fund should be okay:
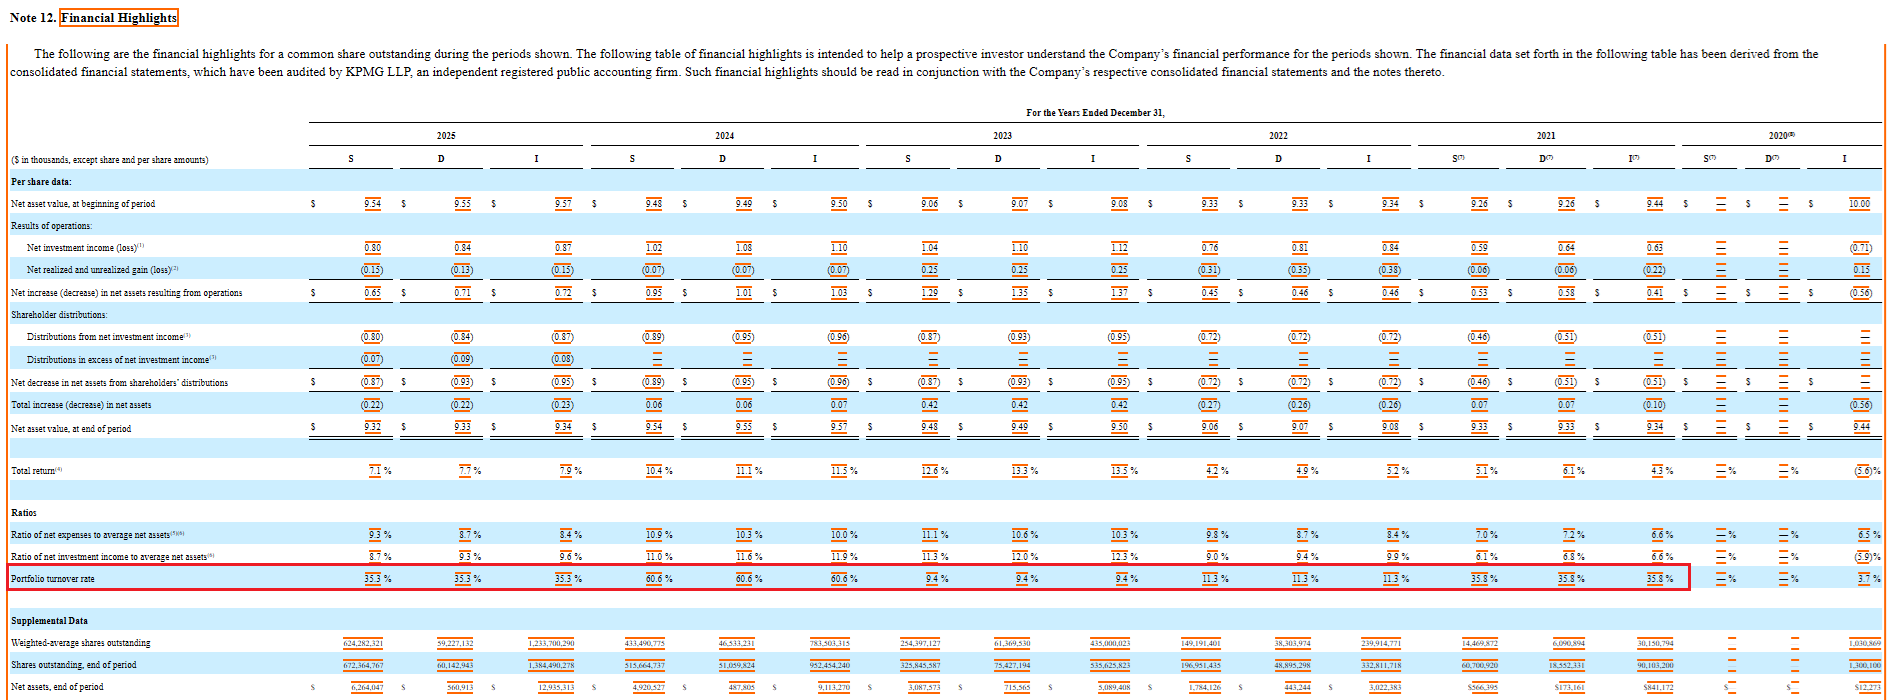
1) Portfolio turnover and the 5% quarterly tender – OCIC tenders for 5% of its fund each quarter, or roughly 20% per annum, irrespective of the amount of redemption requests. This quarterly repurchase activity matches the cadence of the underlying portfolio turnover of the fund, which averaged 30.5% per year over the past five years. Last year, OCIC had loan repayments of $11.5 billion compared to a maximum redemption liability of $4.0 billion (20% of the fund’s net assets). Blue Owl estimates that OCIC will receive $2.0 of loan repayments per quarter in normal course.
In OCIC’s case, as with most other non-traded BDCs in private credit, portfolio liquidity roughly matches redemption liability, resulting in a somewhat minimal asset liability mismatch.
Source: OCIC 10-K
2) Net flows – While the headline tender request of 21.9% gets a lot of attention, net fund flows are ultimately what matter. In the first quarter, OCIC had $872 million of inflows against the $988 million of outflows from the tender offer, resulting in net outflows of just $116 million, representing 0.6% of the fund.
That said, we do expect inflows to slow in the subsequent quarters. However, many private credit funds (including OCIC) have distribution reinvestment plans that automatically reinvest cash distributions, contributing to consistent inflows.
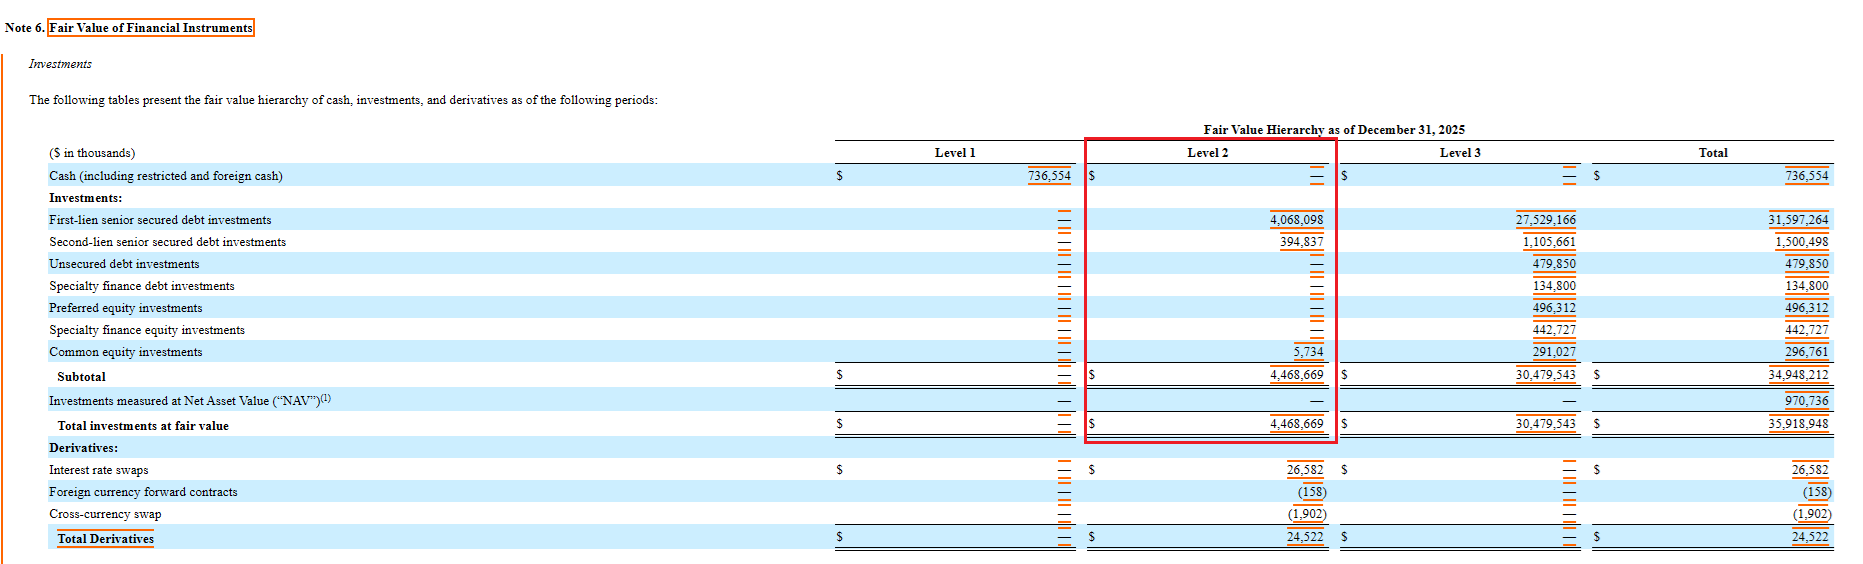
3) Level 2 assets – As the non-traded BDC space became overwhelmed with capital inflows from 2023 to 2025, many non-traded BDCs (including OCIC) turned to the liquid public loan market as a stop-gap measure, as they could not deploy the capital into direct lending.
As a result, OCIC now has $4.5 billion of level 2 assets, including liquid public loans, representing 12.5% of its portfolio. These assets can be readily liquidated to cover a couple of quarters of redemptions (irrespective of loan repayments).
Source: OCIC 10-K
4) Leverage – OCIC has a target leverage ratio (debt:equity) of 1.0x to 1.25x. It is currently at 0.75x (net of cash). It has nearly $10 billion of additional room to meet the high end of its leverage target, meaning it can shrink its NAV by nearly $10 billion, or -50%, before having to reduce the size of its loan book. OCIC has $3.5 billion of current liquidity under its credit facility and SPVs, plus $0.7 billion of cash on its balance sheet.
Moreover, a -25% decline in net assets (5 quarters of redemptions) represents the reversal of last year’s AUM growth.
Source: OCIC 10-K
However, a shrinking fund holding illiquid assets does pose some risks and concerns. OCIC has unfunded loan commitments of $5.3 billion that need to be managed in the context of the fund shrinking, offsetting various channels of liquidity.
Despite evidence indicating that OCIC should be be able to manage large ongoing redemption requests for multiple subsequent quarters or years, this does not necessarily mean that it is a good investment in the current environment. Anyone subscribing to OCIC at this point in time will only serve as exit liquidity for redeeming investors.
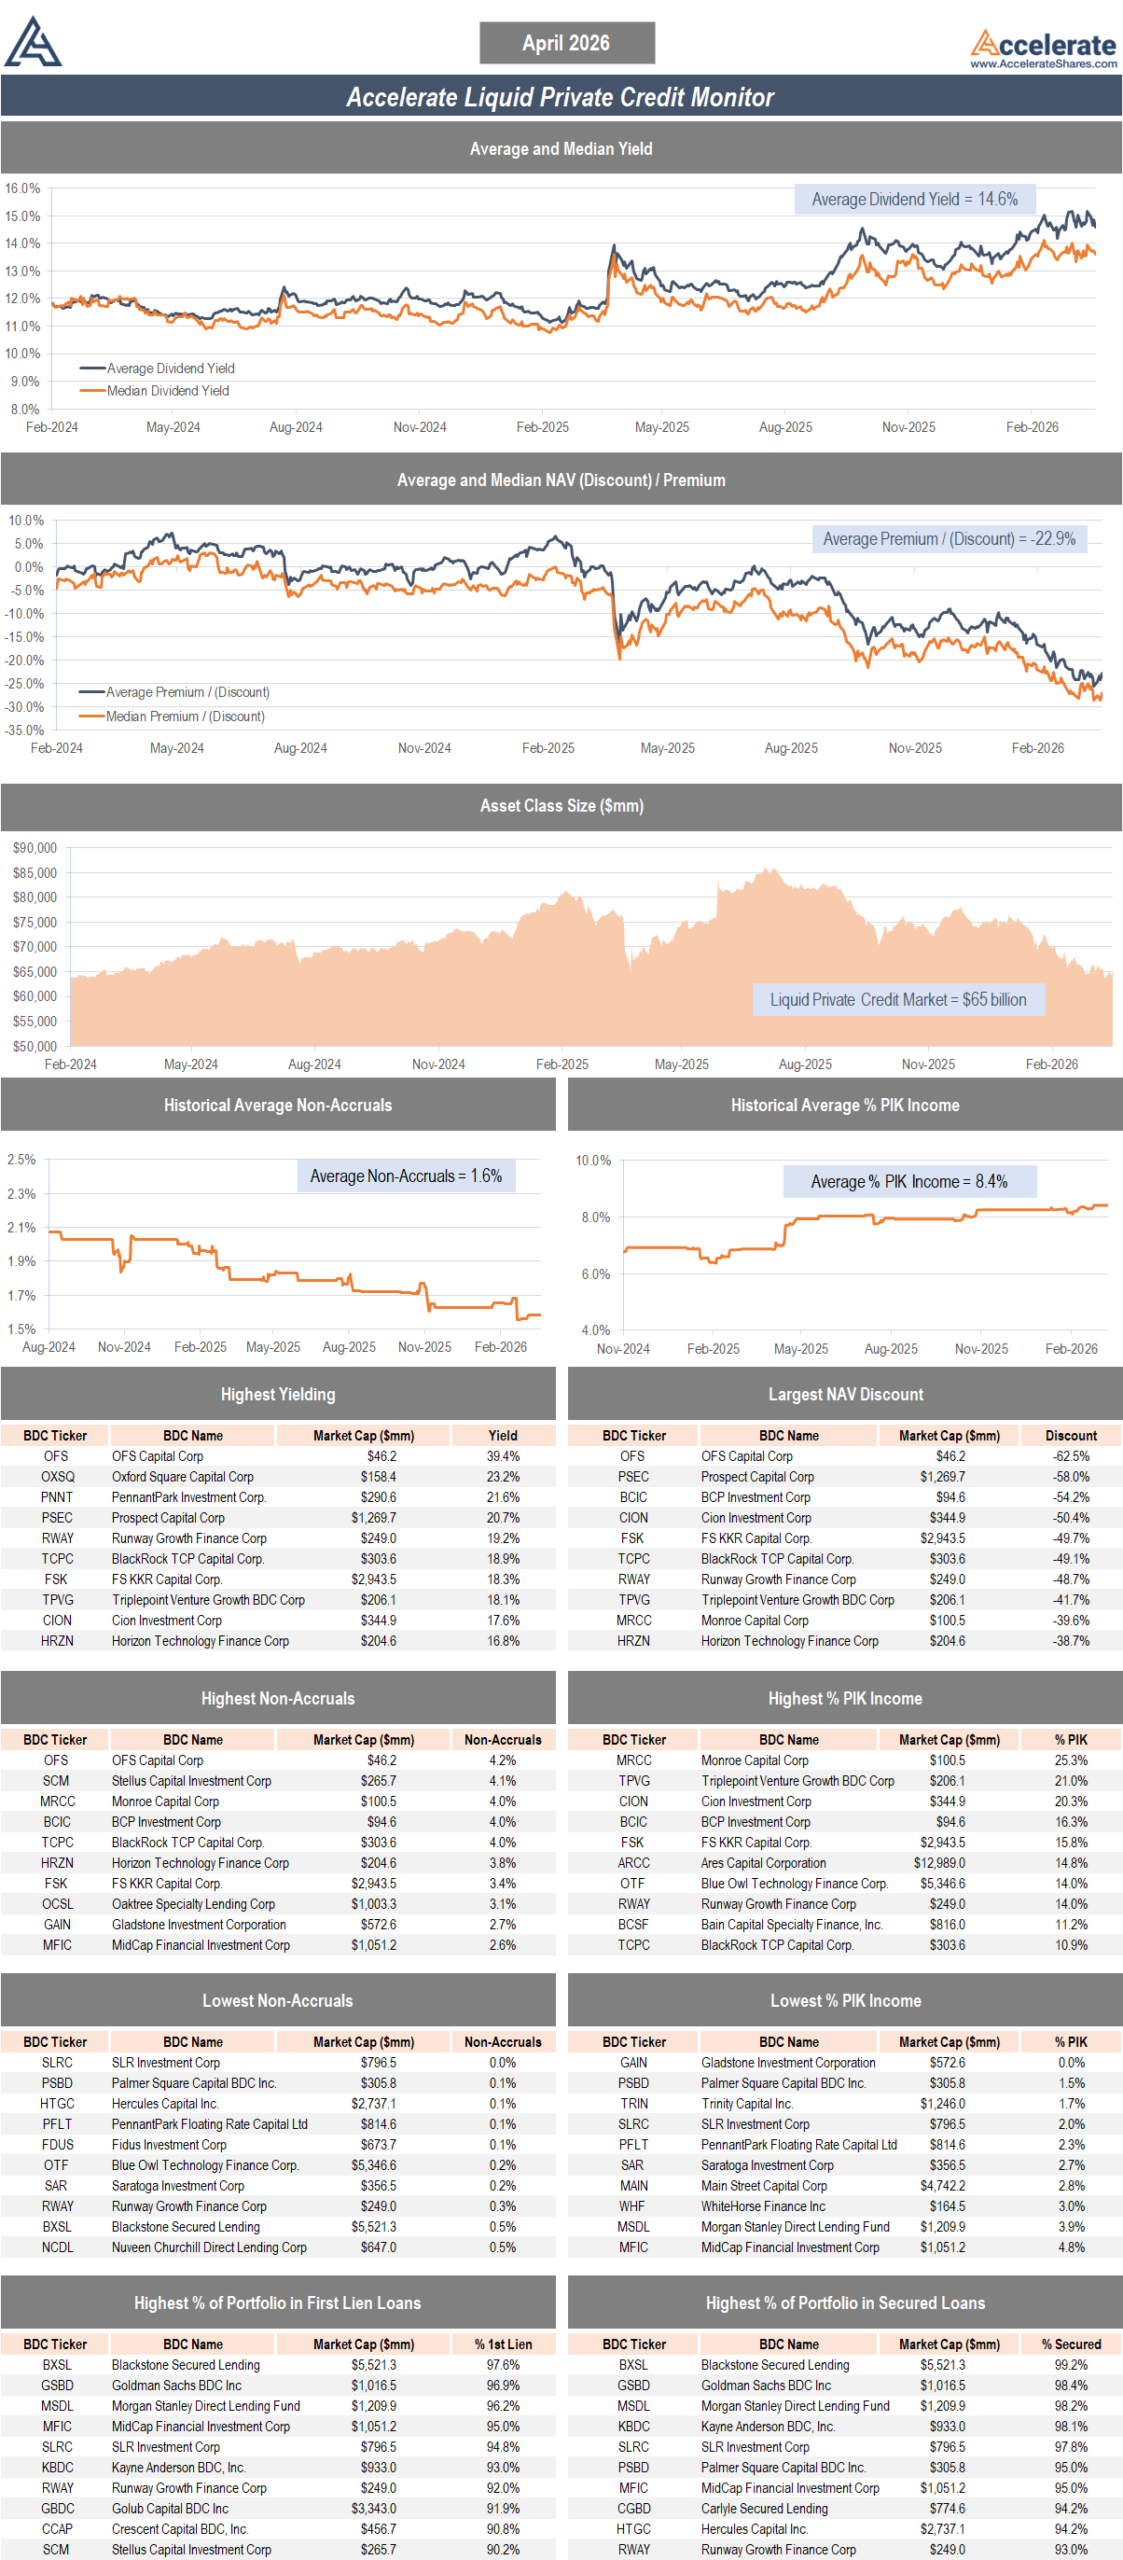
Irrespective of underlying credit fundamentals, another dynamic is driving significant redemptions from non-traded BDCs. There is a universe of publicly-traded BDCs, which are available to purchase or sell at any time the stock market is open. Since sentiment began to weaken last fall and picked up over the first two months of 2026, the prices of listed BDCs have dropped significantly. Last February, listed BDCs traded above their NAV on average. Now, given negative price performance, the average BDC trades at a nearly -25% discount to its NAV.
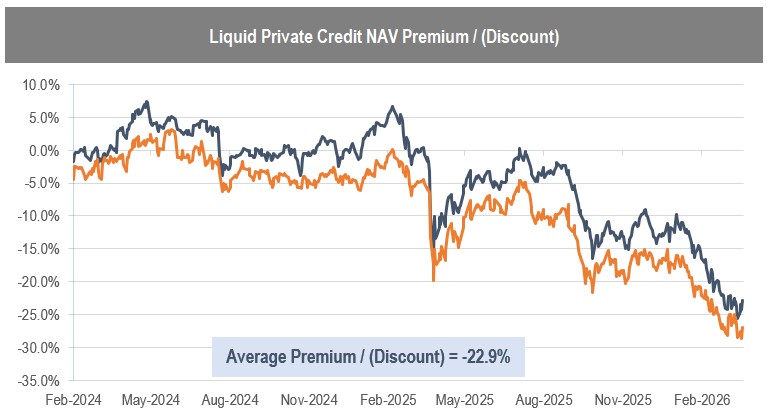
Source: Accelerate
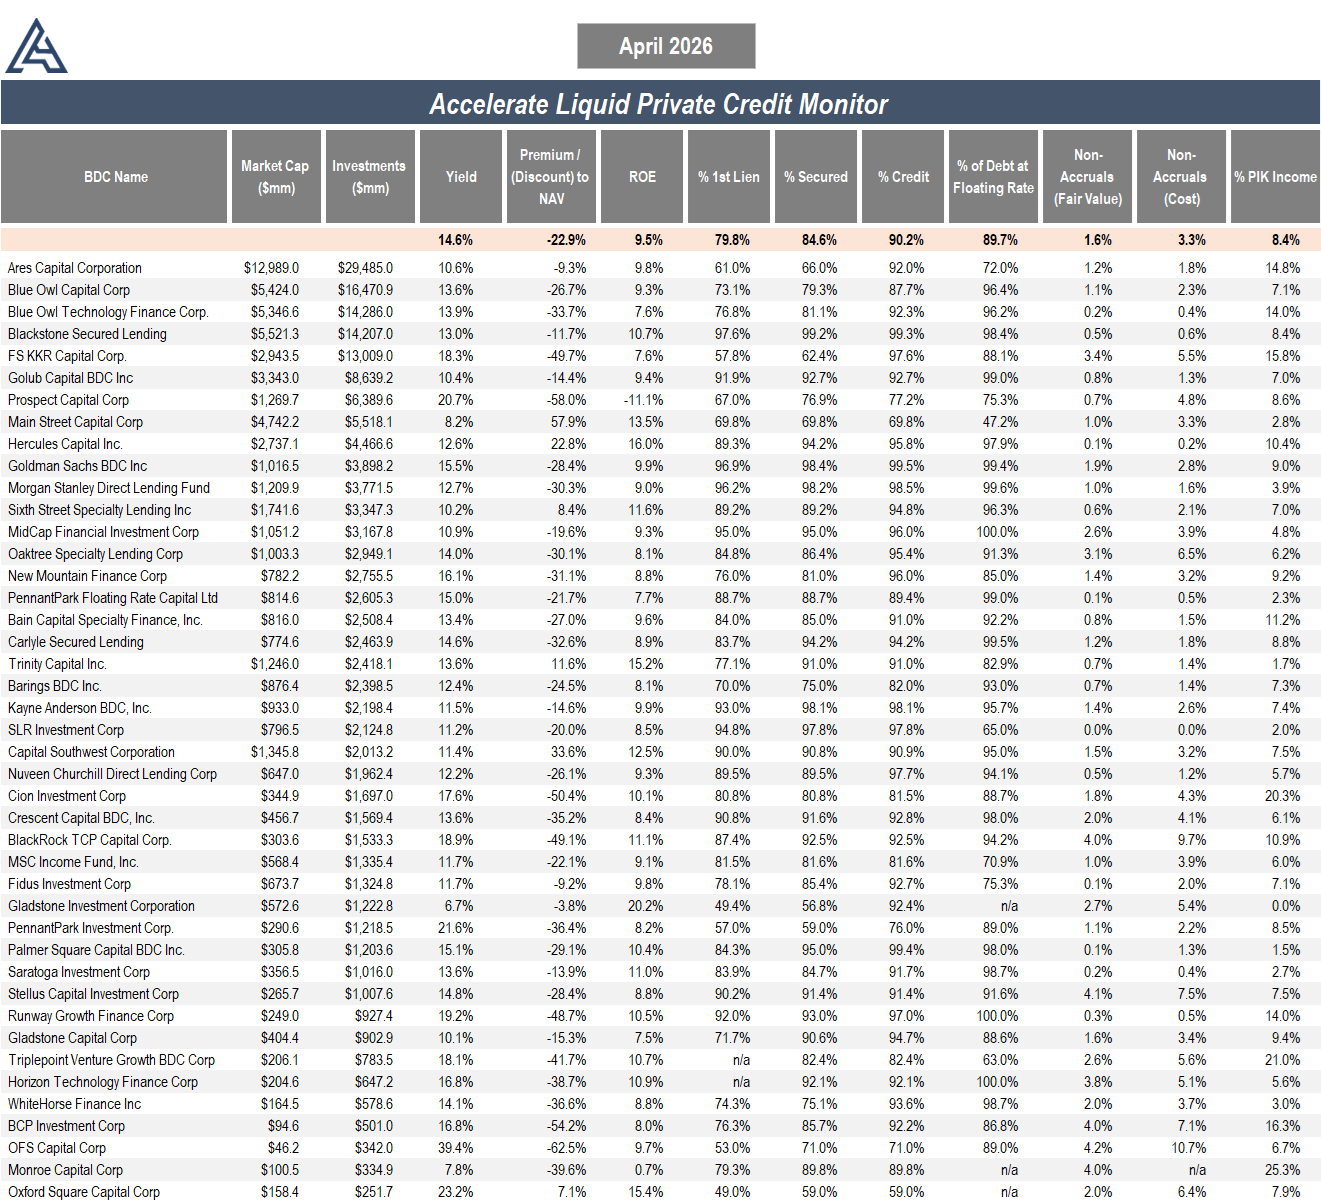
Blue Owl offers two publicly traded BDCs, Blue Owl Capital (NYSE: OBDC) and Blue Owl Technology Finance (NYSE: OTF), that hold similar private credit portfolios to those of their non-traded BDCs. Currently, Blue Owl’s publicly-traded BDCs, OBDC and OTF, trade at NAV discounts of -26.7% and -33.7%, respectively.
As long as OBDC and OTF are at double-digit NAV discounts, OCIC will likely continue to suffer outflows. The “arbitrage”, in which one can exit the non-traded BDC at NAV (subject to proration) and buy the traded BDC, is quite obvious.
Ultimately, this redemption and net outflow cycle will last several quarters or years until credit market sentiment improves and NAV discounts in public BDCs decline.
That said, OCIC as a fund and private credit as an asset class will shrink writ large. This decline is a reasonable expectation for most non-traded BDCs. However, this dynamic is not necessarily true for drawdown or listed BDC structures (unless they are actively repurchasing shares at NAV discounts – which we encourage as long as liquidity allows, and certainly they should favour buybacks over new deployments).
As nontraded BDCs shrink, there are two negative effects on the portfolios:
- Portfolio quality declines as performing credits are repaid, while troubled credits are amended and extended, or convert to PIK, worsening credit quality.
- Portfolio risk increases as loan concentration rises. Loan positions as a percent of the portfolio will increase as the fund shrinks. The effect of the unwind worsens the portfolio for non-redeeming investors, exacerbating the problem and encouraging the redemption spiral to continue.
Historically, the -25% average listed BDC NAV discount has only been wider in late 2008 to early 2009 and March to April of 2020. Both of these environments featured significant recessions and scenarios in which the world seemed to be ending (or felt so at the time). Historical returns from those points for listed BDCs were exceptional. On average, BDC bear markets have lasted approximately 12 months as prices recover to in line with NAV. Sure, this time could be different, but if credit goes bad here, it is reasonable to expect that equities will be in for a nasty bear market.
Q4 Performance
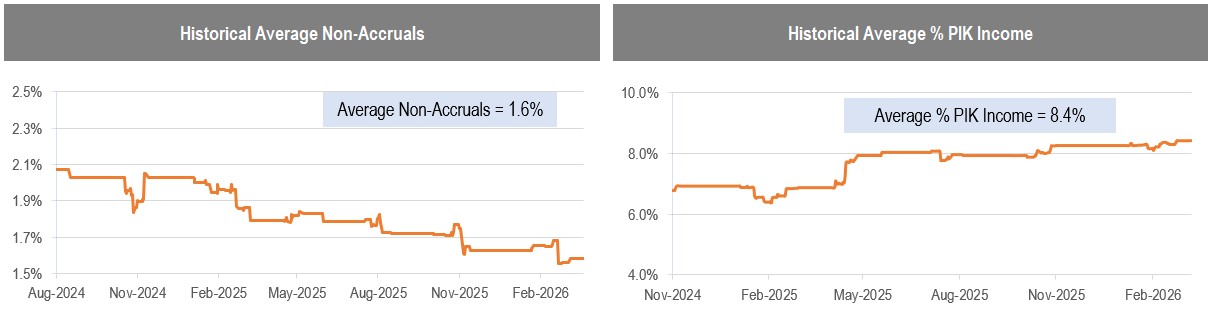
Fourth quarter performance of private credit, through the lens of publicly-traded BDCs, was mediocre. While credit conditions remain somewhat benign, with average non-accruals declining by -10bps to 1.6% and average PIK income rising by 10bps to 8.4%, there were certain idiosyncratic credit losses that hurt several fund’s quarterly performance.
Source: Accelerate
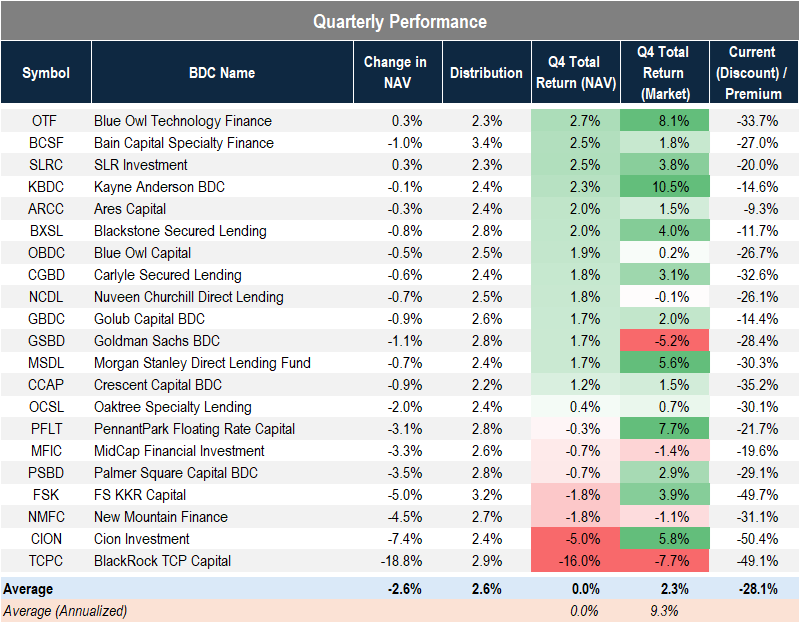
In our liquid private credit coverage universe, most funds displayed modest to good quarterly performance. Ironically, it was Blue Owl’s fund that posted the top performance in the quarter (primarily due to its investment in SpaceX). Top tier credit firms Ares and Blackstone continued their consistent positive performance. In addition, Kayne Anderson, SLR, and Bain Capital contributed great results in Q4.
In contrast, BlackRock TCP had a painful Q4, highlighted by large losses in its loan book. These losses were mostly caused by legacy credits that had previously been restructured and represented continuous problems for the fund over the past few years, such as Amazon aggregators Razor and SellerX. 91% of the fund’s NAV reduction was tied to investments that were underwritten in 2021 or earlier.
Additionally, CION, New Mountain, and FS KKR exhibited negative quarterly performance, as loan losses exceeded fund distributions.
Taking all of this into account, average Q4 total returns for the listed BDCs under coverage were flat, compared to a market total return of +2.3% for these funds.
Source: Accelerate, Bloomberg
On the Q4 conference calls held by these funds, there were two focus areas of discussion: share repurchases and software exposure.
With nearly all listed BDCs trading at double-digit discounts to NAV, repurchasing shares at these levels is highly accretive. Apollo’s MidCap Financial (NASDAQ: MFIC) put it best: “At these trading levels, we continue to believe allocating capital toward stock repurchases is more accretive than deploying capital into new investments.” Buying back shares at 11% to 13% makes far more sense than underwriting new loans at 8% to 9%.
There remains significant investor concern around software credit exposure. The listed BDC sector has an average 16.7% software exposure (22.0% on a weighted average basis), ranking it as a top three sector within private credit. While there remain idiosyncratic credit issues in software, such as legacy name Pluralsight along with the newly distressed Medallia (both of which were ARR loans), thus far there have been minimal credit issues due to AI disruption. However, much of the concern remains the refinancability of software loans three to five years out – a concern which cannot be disproven at this time.
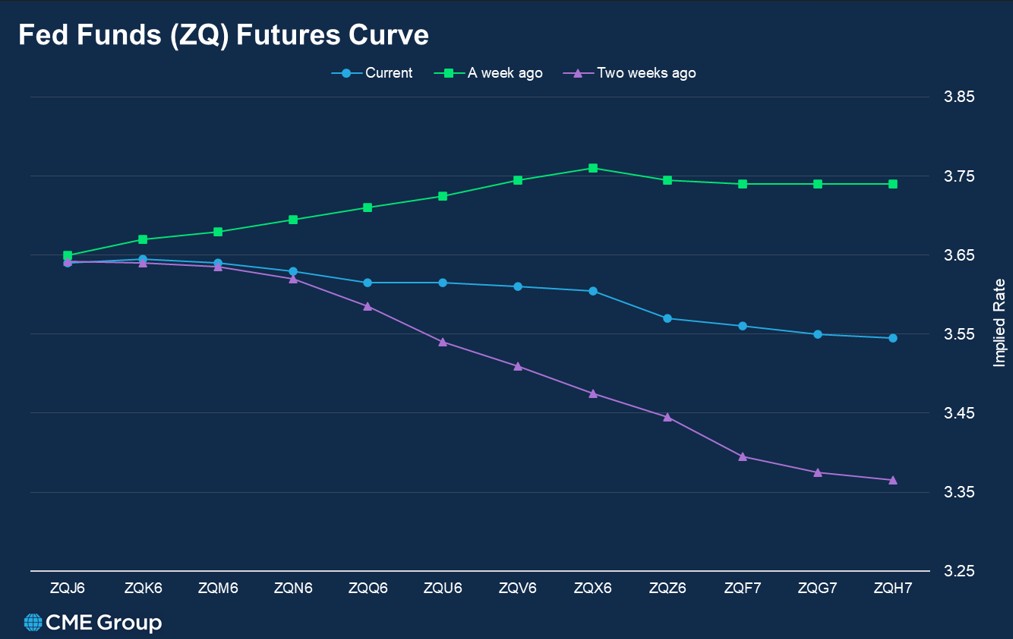
On a positive note, two macro tailwinds are emerging for the asset class. First, as a result of the conflict in the Middle East, the outlook for inflation, and thus rate cuts, has changed dramatically. Heading into 2026, the market’s expectation was for two rate cuts this year. Over the past month, the probability of any rate cuts this year disappeared, while fed fund futures began pricing in a potential rate hike from the Federal Reserve in 2026. Since private credit loans are typically floating rate, a higher fed funds rate leads to higher private credit yields (assuming spreads remain constant).
Second, due to inflows turning to outflows in non-traded BDCs and a new focus on share repurchases by listed BDCs, the supply of capital in direct lending is falling quickly. As the supply of capital within private credit declines, we expect spreads on new loans to widen. Ultimately, wider spreads are expected to lead to a better risk-reward profile for the asset class. Once this occurs, attractive returns bring back investors, outflows turn to inflows, discounts turn to premiums, and a new cycle begins.
The Accelerate Liquid Private Credit Monitor is utilized in running the Accelerate Diversified Credit Income Fund (TSX:INCM, INCM.B, INCM.U), which may have positions in some of the securities mentioned.
Each individual merger is assigned a risk rating:
- AA – a merger arbitrage rated ‘AA’ has the highest rating assigned by AlphaRank. The merger has the highest probability of closing.
- A – a merger arbitrage rated ‘A’ differs from the highest-rated mergers only by a small degree. The merger has a very high probability of closing.
- BBB – a merger arbitrage rated ‘BBB’ is of investment grade and has a high probability of closing.
- BB – a merger arbitrage rated ‘BB’ is somewhat speculative in nature and has a greater than 90% probability of closing.
- B – a merger arbitrage rated ‘B’ is speculative in nature and has a greater than 85% probability of closing.
- CCC – a merger arbitrage rated ‘CCC’ is very speculative in nature. The merger is subject to certain conditions that may not be satisfied.
- NR – a merger-rated NR is trading either at a premium to the implied consideration or a discount to the unaffected price.
The AlphaRank merger analytics database is utilized in running the Accelerate Arbitrage Fund (TSX: ARB), which may have positions in some of the securities mentioned.


