
Accelerate Canadian Long Short Equity Fund
Equity Plus.
The Accelerate Canadian Long Short Equity Fund (TSX: ATSX) is a directional long-short equity hedge fund that seeks to provide upside market exposure while limiting downside participation.
About the Fund
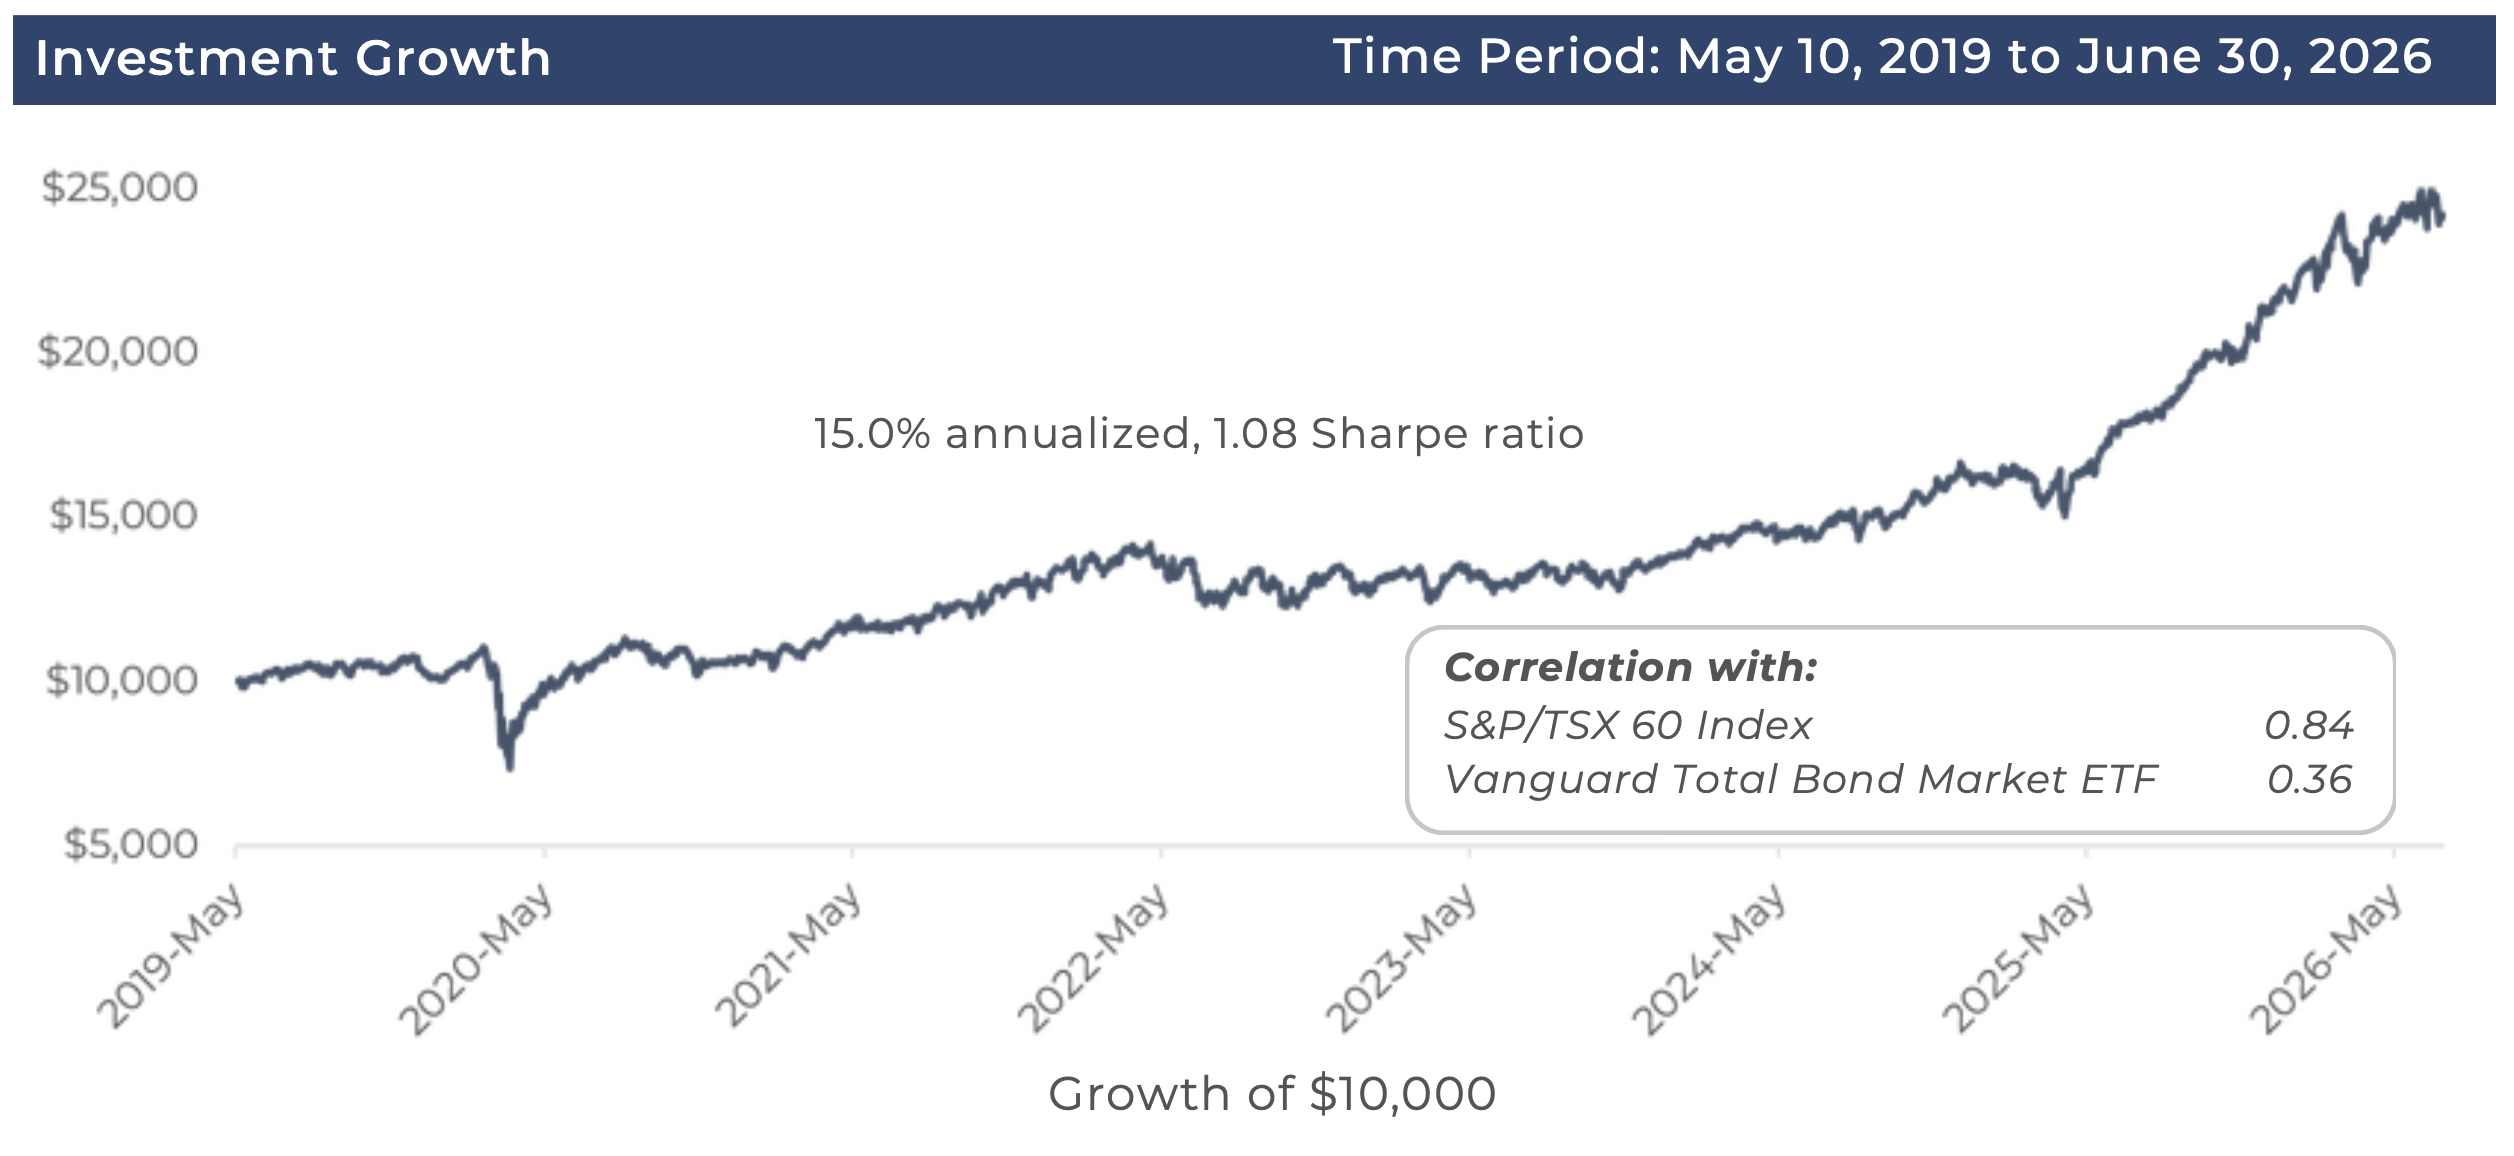
The Accelerate Canadian Long Short Equity Fund (TSX: ATSX) is a quantitative 150-50 long-short equity hedge fund that seeks to outperform the S&P/TSX 60.
Investment Objectives
-
-
- Outperform the broad Canadian equity index
- Provide volatility in-line with the broad Canadian equity index
-
ATSX TRADING DATA
NAV:
Date:
MEDIA
SUBSCRIBE TO OUR DISTRIBUTION LIST TO STAY UPDATED ON HDGE
QUICK FACTS
Type:
Directional long short equity
Structure:
Alternative ETF
Date Started:
May 10, 2019
Management Fee:
0.00%
Performance Fee:
1/2 of outperformance above S&P/ TSX 60 Total Return
Investment Manager:
Accelerate Financial Technologies Inc.
Distribution:
n/a
Exchange:
TSX
Currency:
CAD
Risk Rating:
Medium
Track Record
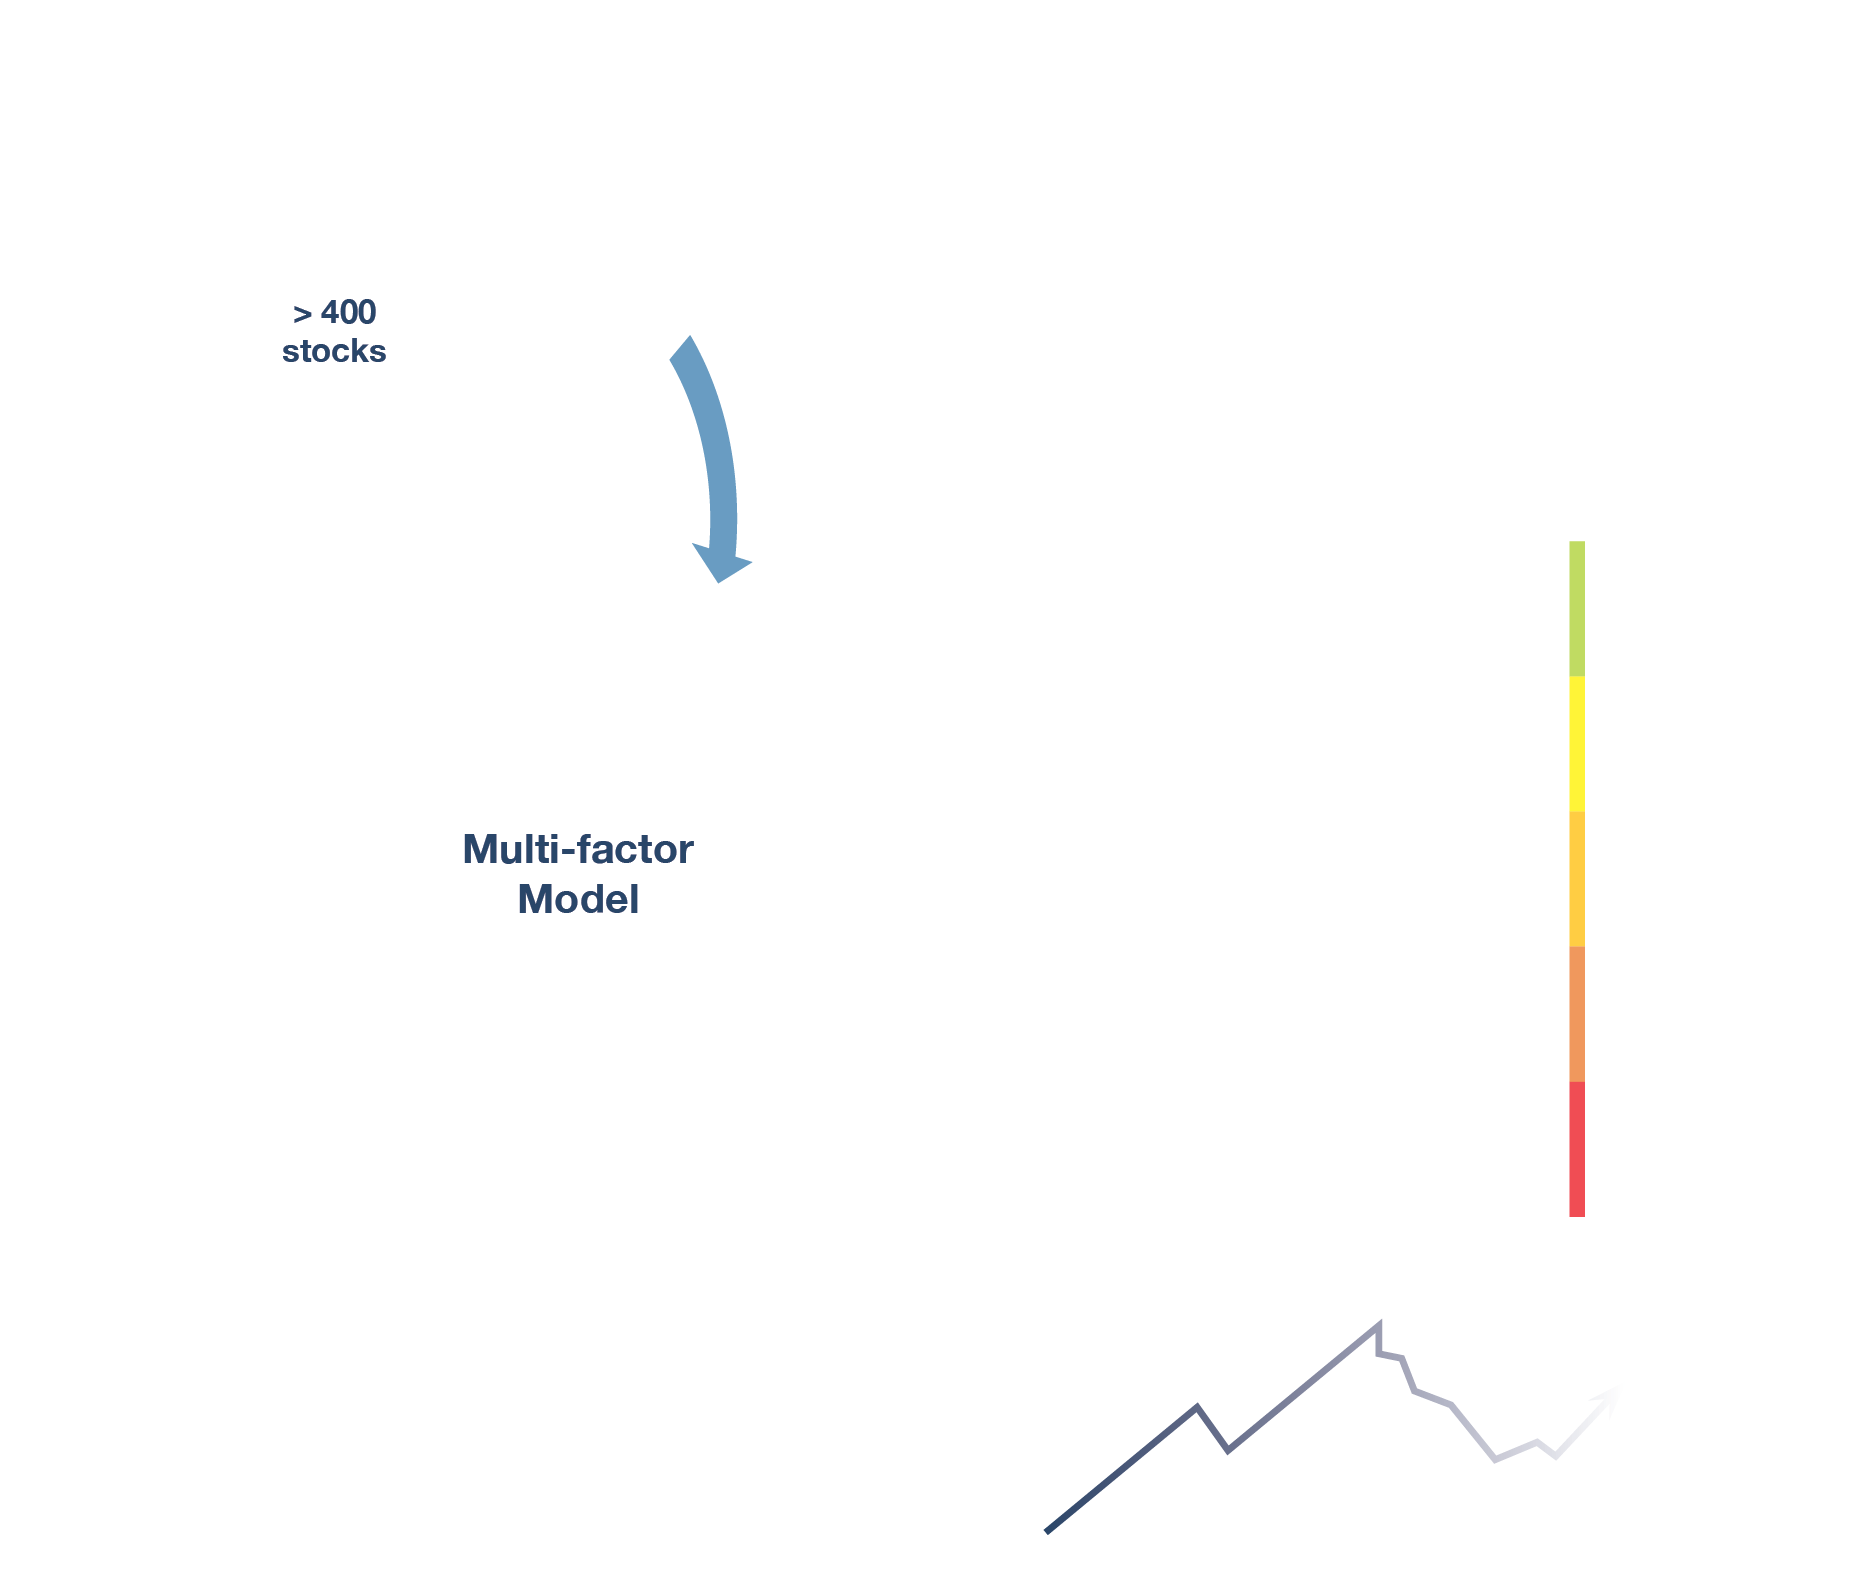
Investment Process
ATSX utilizes a systematic, proprietary multi-factor model to sort and rank all liquid Canadian stocks based on five principal factors: Value, Price Momentum, Operating Momentum, Quality, and Trend.
The Fund goes long a portfolio of the highest expected return stocks selected from the top ranking from the multi-factor model while going short a portfolio of the lowest expected return stocks selected from the bottom ranking. The portfolio is rebalanced on a monthly basis. The long portfolio is up to 150% of NAV and the short portfolio is up to -50% of NAV
Performance as of 2026-Jun-30
| 1 Month | 3 Months | YTD | 1 Year | 3 Years | 5 Years | Since Inception | ||
|---|---|---|---|---|---|---|---|---|
| ATSX | -0.9% | 4.8% | 13.0% | 40.4% | 26.6% | 18.1% | 15.0% |
Fund Characteristics as of 2026-Jun-30
| Long | Short | |
|---|---|---|
| Number of Securities | 42 | 40 |
| Average Market Cap ($mm) | $47,356 | $18,222 |
| Median Market Cap ($mm) | $17,591 | $9,043 |
| Beta | 1.1 | 1.2 |
| EBITDA/EV | 11.5% | 6.1% |
| FCF/EV | 5.8% | 0.5% |
| Trailing Return | 65.1% | 16.3% |
| Pct of 52 Week High | 87.9% | 73.8% |
| Return on Capital | 19.7% | 2.4% |
| Gross Profits/Assets | 7.4% | 3.2% |
| 50 DMA to 200 DMA | 112.0% | 97.0% |
| EPS Revision | 0.3% | -0.3% |
| Change In Shares | -2.1% | 5.0% |
| Earnings Abnormal Return | 3.1% | -2.9% |
Sector Weightings as of 2026-Jun-30
| Long | Short | |
|---|---|---|
| Communication Services | 3.6% | -2.3% |
| Consumer Discretionary | 10.9% | -1.2% |
| Consumer Staples | 10.9% | 0.0% |
| Energy | 29.0% | -4.7% |
| Financials | 21.8% | 0.0% |
| Health Care | 0.0% | -1.2% |
| Industrials | 25.4% | -8.2% |
| Information Technology | 0.0% | -2.3% |
| Materials | 47.2% | -17.5% |
| Real Estate | 0.0% | -2.3% |
| Utilities | 3.6% | -7.0% |
Top Holdings as of 2026-Jun-30
| Long Security Name | Weight | |
|---|---|---|
| Bank of Montreal | 3.6% | |
| Royal Bank of Canada | 3.6% | |
| Canadian Natural Resources Ltd | 3.6% | |
| Exchange Income Corp | 3.6% | |
| Agnico Eagle Mines Ltd | 3.6% | |
| North West Co Inc/The | 3.6% | |
| Hudbay Minerals Inc | 3.6% | |
| Aritzia Inc | 3.6% | |
| Barrick Mining Corp | 3.6% | |
| Aris Mining Corp | 3.6% | |
| Wesdome Gold Mines Ltd | 3.6% | |
| Centerra Gold Inc | 3.6% | |
| Linamar Corp | 3.6% | |
| Torex Gold Resources Inc | 3.6% | |
| IAMGOLD Corp | 3.6% | |
| Keyera Corp | 3.6% | |
| Superior Plus Corp | 3.6% | |
| Pembina Pipeline Corp | 3.6% | |
| CCL Industries Inc | 3.6% | |
| B2Gold Corp | 3.6% | |
| Mattr Corp | 3.6% | |
| Imperial Oil Ltd | 3.6% | |
| Trican Well Service Ltd | 3.6% | |
| Great-West Lifeco Inc | 3.6% | |
| Finning International Inc | 3.6% | |
| Canada Goose Holdings Inc | 3.6% | |
| George Weston Ltd | 3.6% | |
| Quebecor Inc | 3.6% | |
| Endeavour Mining PLC | 3.6% | |
| IGM Financial Inc | 3.6% | |
| Loblaw Cos Ltd | 3.6% | |
| Kinross Gold Corp | 3.6% | |
| Cenovus Energy Inc | 3.6% | |
| Chorus Aviation Inc | 3.6% | |
| OceanaGold Corp | 3.6% | |
| Canadian National Railway Co | 3.6% | |
| Suncor Energy Inc | 3.6% | |
| Bank of Nova Scotia/The | 3.6% | |
| Toromont Industries Ltd | 3.6% | |
| National Bank of Canada | 3.6% | |
| TFI International Inc | 3.6% | |
| Bombardier Inc | 3.6% |
EXPLORE OTHER INVESTMENT SOLUTIONS


DISCLAIMER: This information on this web page does not constitute investment, legal or tax advice. Performance is inclusive of reinvested distributions. Past performance is not indicative of future results. Any data provided on this web page should not be viewed as a recommendation or solicitation of an offer to buy or sell any securities or investment strategies. The information on this web page is based on market conditions and may fluctuate and change without notice. Accelerate does not accept any liability for any direct, indirect or consequential loss or damage suffered by any person as a result of relying on all or any part of this website and any liability is expressly disclaimed.

