

![]()
September 19, 2019 – The world’s vast oceans provide people with endless potential pursuits, whether it be surfing, swimming, body-boarding, scuba diving or snorkeling. Yet with these activities, people need to be mindful as potential life-threatening danger can lurk beneath the surface.
Rip currents pose some of the most significant risks for ocean-goers. They present one of the ocean’s deadliest tricks. The water can appear calm on the surface, but below can hide a potentially deadly river-like channel of water that can rapidly pull swimmers away from the shore. Every year, hundreds of people drown after getting caught in rip currents.
Long-Short Investors Get Caught in the Rip Current
The markets appeared relatively calm through the first seven trading sessions of September, with the S&P 500 rising 2.6% and the S&P/TSX Composite gaining 1.1% with relatively low volatility. The volatility index remained tepid, trading between 13 and 20, in-line with its historical average. However, these rather pedestrian returns and muted volatility hid a deadly rip current rushing underneath.
As the broad market indices plodded along, long-short investors were suffering jaw-dropping volatility as major factor returns experienced their largest whipsaw in a decade.
Over the near-to-medium term, it isn’t surprising to have factor underperformance. Expensive stocks can outperform cheap ones, low quality stocks can outperform good ones or stocks with a negative trend can reverse and outperform positive trending stocks.
What made September’s factor performance so shocking was the velocity of the move. Similar to an unsuspecting swimmer wading out into the calm water only to get sucked in by a vicious rip current, price momentum factor investors suffered one of the most severe reversals ever.
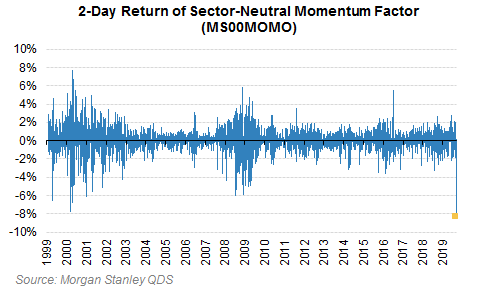
The 2-day return of the price momentum factor on September 9th and 10th was the worst on record, dropping more than -8%. Junk stocks rallied hard while high-flyers dropped precipitously.
Source: Financial Times
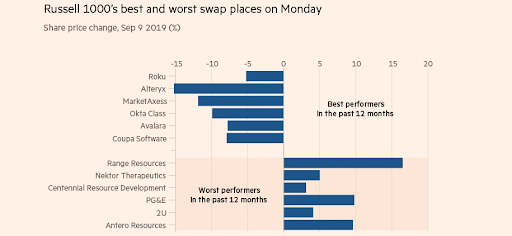
The move was unrelated to any news, sector or macro effects. Some have pointed to a brief rise in interest rates, but that would not explain the massive dead-cat bounce in the junk stocks seemingly circling the drain. The worst half-dozen performers over the past 12 months in the Russell 1000 index rallied nearly +10% on September 9th, while the best performers fell an equal and opposite amount.
Source: Accelerate, Compustat, S&P CapitalIQ
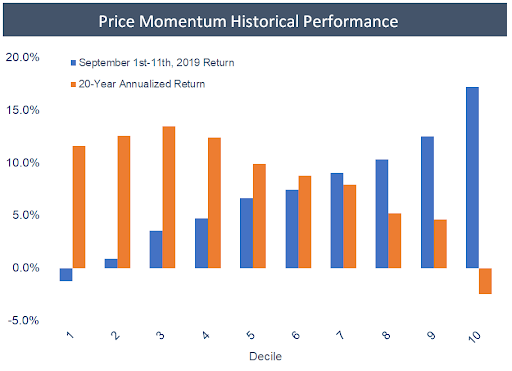
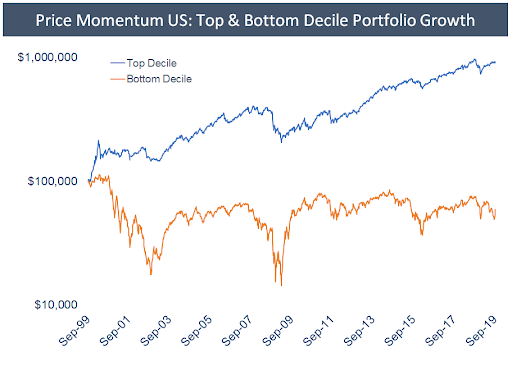
The most notable data point from early September’s market action was that the price momentum factor performed in the exact opposite way as how one would expect. Historically, the top decile price momentum stocks, those with the highest 12-month returns and nearest their 52-week high, continue to experience strong returns, and vice versa with the bottom decile price momentum stocks continuing with their weakness and declining in value.
Between September 1st and September 11th, the long-short price momentum portfolio (being top decile price momentum stocks minus bottom decile price momentum stocks) had a 7-session return of -19.6%. This loss lies in stark contrast to the 14.0% average annualized spread between the top decile price momentum portfolio and the bottom decile exhibited over the past twenty years.
Where the Heck was Value?
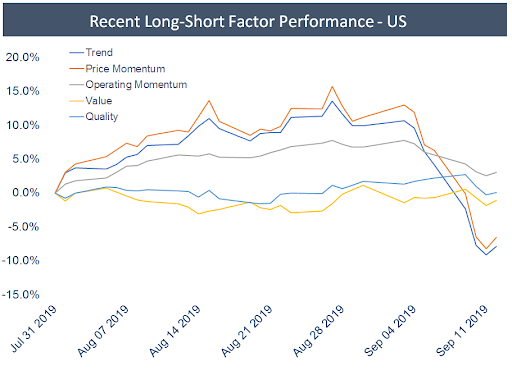
The beauty of the value factor is that typically it is negatively correlated with price momentum, and that of price momentum’s closely-related cousin, trend. However, during the price momentum portfolio’s face-ripping reversal, value was nowhere to be found.
The long-only top decile value portfolio has had exceptional performance thus far in September, rallying 10% over the first seven trading days. Still, this performance was completely negated by the bottom decile value portfolio (stocks with the least attractive valuation) as these stocks increased in price just as much. During the highly unusual and violent price momentum reversal, the long-short value portfolio offered zero correlation with its negligible performance. Ditto for quality and operating momentum portfolios, with all three contributing effectively little benefit to multi-factor portfolios.
Source: Accelerate, Compustat, S&P CapitalIQ
The lack of participation of value, which historically would have rallied as price momentum fell, makes the market action of early September even more confounding.
Nonetheless, short term market moves can be difficult to interpret and ascribe a fundamental basis for an explanation. Lacking any sort of macro catalyst, the great price momentum reversal, concentrated in the bottom decile price momentum portfolio (i.e. a massive short squeeze), could be related to the rapid unwind of a long-short US price momentum stock trade. Short portfolios can be particularly fickle and volatile. They typically experience frustrating rallies as the shorts work their way to zero, especially when a fund is suffering from margin calls and rushing to cover its short book.
Source: Accelerate, Compustat, S&P CapitalIQ
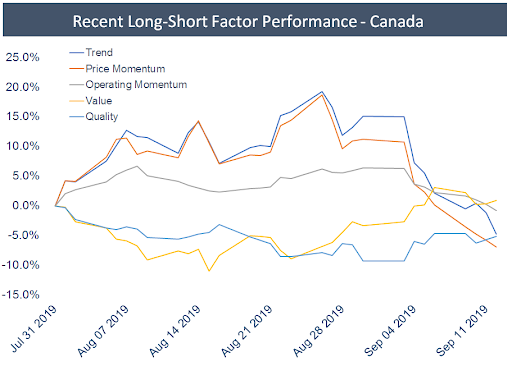
Early September factor performance in Canada exhibited the same characteristics, with the long-short price momentum portfolio and its close cousin trend getting pummeled for approximately -25%. Canadian value and quality long-short portfolios had slight negative correlation to price momentum, notching slight gains as the price momentum portfolio suffered. As was the case in the US market, the long-short price momentum portfolio suffered the vast majority of its losses from the short book. It was a trademark short squeeze.
Bottom Line? Stick with it
While the recent drawdown in the long-short price momentum factor was painful, and the short squeeze driven by surging junk stocks was not fun, long-short price momentum portfolios can be expected to produce positive returns more often than not.
Source: Accelerate, Compustat, S&P CapitalIQ
Long-short price momentum portfolios have a great track record of producing alpha for investors over the long-term. Logically it makes sense. If you think about it, the most prolific compounding stocks over time keep hitting new highs, while the stocks on their way to zero keep hitting new lows. That being said, the price momentum factor, along with any other good long-term investment strategy, will periodically suffer bouts of underperformance.
This fascinating dichotomy is inherent to investing – to have attractive long-term performance, a strategy is required to have short-term downturns that scare investors away. It is necessary because if the strategy worked all the time, paradoxically, it would cease to work because everyone would do it.
Regardless, the significant volatility of a long-short price momentum portfolio makes it inappropriate as a stand-alone investment strategy. However, given its track record of considerable long-term returns, it makes for an attractive, alpha-producing addition to a multi-factor mandate.
Investment strategies going “up and to the right” seem to display a return profile that is characterized by a relatively calm a stable march upwards when viewed from a long-term perspective. Yet if one examines this return profile up close, it will typically reveal staggering volatility on a short-term basis. These attractive long-term price charts mask the inherent volatility that occurs in the day-to-day, just as tranquil ocean water can conceal risky rip currents below.
As dealing with the uncertainty beneath the surface is necessary for ocean-goers to enjoy their avocation of choice, volatility and the occasional short squeeze are the price one pays in the pursuit of long-term investing outperformance.
-Julian

