


October 13, 2025 – Benjamin Graham’s 1949 book, The Intelligent Investor, is widely regarded as the foundational text of value investing and is one of the most influential books ever written on investing philosophy.
In the book, Graham guides investors to view securities as fractional ownership of real economic enterprises, not as speculative instruments to trade based on market sentiment. The book’s main objective is to help investors become “intelligent” – meaning rational, skeptical, and guided by fundamental investing principles rather than emotion or hype.
The primary guiding principle in The Intelligent Investor is the buying of an asset based on a margin of safety, based on a discount to one’s view of intrinsic value, as opposed to speculative trading based on price movements, sentiment, or short-term trends.
Investing with a margin of safety involves purchasing assets at a substantial discount to their intrinsic value to protect against errors in judgment or unforeseen market declines.
Graham stated that “In the short run, the market is a voting machine. In the long run, it is a weighing machine”. At any given time, the prices of securities reflect their popularity, along with the emotion and opinion of a broad set of market participants, not necessarily the securities’ fundamental value. Investors and speculators are effectively voting with their dollars on which securities they like or dislike at the moment. For example, a trendy tech stock might soar because investors feel optimistic about AI or quantum computing, even if its profits are many years away (if ever). Conversely, a boring private credit fund may languish in the secondary market, even if it generates a high yield and trades at a significant discount to its intrinsic value.
While the data is limited, because the S&P 500 has rarely traded at 23x earnings (where it is currently), when the stock market has been this expensive historically, subsequent 5-year returns were flat to negative on a total return basis.
 Source: JPMorgan Guide to the Markets
That said, the large-cap growth focused S&P 500, an actively managed stock index launched by Standard & Poor’s in 1957 and the most popular barometer of stock market performance, is currently heavily weighted toward the “Magnificent 7” technology giants, which ultimately represent a bet on artificial intelligence. Some argue that the index’s diversification benefits have been reduced, with its large concentration on the AI-factor (which has been working greatly in investors’ favour lately).
AI-related capital expenditures are now estimated to have surpassed the consumer as the primary driver of U.S. economic growth. JP Morgan’s Michael Cembalest notes that “AI-related stocks have accounted for 75% of S&P 500 returns, 80% of earnings growth and 90% of capital spending growth since ChatGPT launched in November 2022.”
For better or worse, AI is now the primary driver of the S&P 500, and the positive sentiment surrounding the game-changing technology has driven the benchmark to near unprecedented valuation levels. However, investors’ overconcentrated bet on this one factor has left them, and the economy, at risk of an AI-related slowdown or setback, particularly given the positive expectations baked into market prices and economic projections.
The Search for Value
While large cap growth equities have rallied to near unprecedented valuations on the back of positive AI sentiment, a smaller, niche area of the capital markets has traded down to become inexpensive, driven by negative sentiment.
As we discussed in this weekend’s edition of Barron’s, “We believe a good investment opportunity has opened up in private credit, via discounted, listed BDCs from leading private credit managers”.
A Business Development Company (BDC) is best described as a liquid private credit vehicle that provides investors access to institutional-grade private credit loans through a publicly traded structure. BDCs primarily invest in senior secured loans that finance businesses owned by private equity funds. We estimate that 85% of the BDC market represents loans to sponsor-backed private companies, with average loan to values (LTVs) of around 40%. These private credit loans have a secured claim at the top of the capital stack of PE-sponsored companies.
BDCs allow public investors (both retail and institutional) to access diversified portfolios of private loans in a transparent, liquid format. In the U.S. market, there are 43 listed BDCs, holding 7,340 loans and investments, of which 90.4% are credit (with the remainder equity), and 84.9% of the loans are senior secured with 90.2% at a floating rate. These BDCs are leveraged at 1.12x on average.
Historically, BDCs have offered investors an attractive total return, primarily via dividends. For example, according to Raymond James, BDCs have outperformed the S&P 500 over the past 5 years, despite the recent drawdown in the sector.
 Source: Raymond James

Currently, out of the top 43 listed BDCs, the median BDC trades at a -21.0% discount (with an average discount of -15.4%) and a median yield of 13.5% (14.4% average yield).
Over the past two decades, there have been five BDC bear markets (including the current one), in which the median BDC has traded to a -20% NAV discount, or greater.
 Source: Cliffwater
Historically, BDCs have traded at NAV premiums nearly as often as they’ve traded at discounts, depending on market sentiment and fund flows.
Nevertheless, the previous four instances in which the median BDC reached a -20% NAV discount have provided investors with attractive forward returns well into the double-digits.

Now, as for the bear case on BDCs, the liquid private credit market has been pressured over the past several months due to a combination of three themes:
- Declining interest rates
- Credit concerns
- Software killing AI
“The private credit market is showing signs of strain as investors pull back from business development companies amid falling payouts and weaker sentiment following the Fed’s rate cuts. With most BDC loans tied to floating rates, declining interest income is forcing major funds, including Blackstone’s and Oaktree’s, to trim dividends for the first time, while others are expected to follow as dividend coverage ratios fall. Shares of leading BDCs like Blackstone Secured Lending and Blue Owl Capital have dropped 15–20% this year, reflecting concerns about tighter yields, rising payment-in-kind debt, and potential credit risks, especially in software lending exposed to AI disruption. Although lower rates reduce borrowing costs for lenders, growing competition and investor skepticism suggest the $1.7 trillion private credit market faces mounting pressure as returns compress and defaults loom as a key risk. “
We believe these bearish views may be misplaced for the following reasons.
1. Declining rates:
Private credit loans, the primary exposure of BDCs, are typically floating-rate loans based on a spread to the Secured Overnight Financing Rate (SOFR). As the Federal Reserve cuts interest rates, SOFR will decline, which will reduce BDC investment income and also the dividends they pay investors (as well as the yields provided by other floating rate assets, such as money market funds and senior loan funds). However, declining interest rates cannot explain the recent bear market drawdown, as declining rates have already been priced into the interest rate futures market throughout 2025, even when BDCs traded at an average 6% premium to NAV in February.
For example, the SOFR curve has barely budged over the past several months as BDC prices have declined by double-digits.

In addition, fed funds futures, which predict the path of the Fed’s interest rate policy, have remained basically unchanged over the past several months, with the market continuing to forecast four to five more rate cuts by the end of 2026.

Lastly, the FOMC’s “dot plot”, which serves as the Fed’s consensus view on the future path of interest rates, has indicated a fed funds rate (average projection) of 300-325 bps in 2027, essentially unchanged throughout this year.

The data show that there have been no indications of a recent significant change in interest rate cut expectations. Moreover, BDCs peaked at an average 6.7% premium to NAV on February 19th of this year, when rate cut expectations were similar to where they are now, but sentiment was markedly different. While the current average BDC yield of 14.4% clearly is not sustainable (because dividends will fall with SOFR and NAV discounts should decline), we view a long-term sustainable yield for the asset class of around cash + 600bps (post leverage net of expenses), which represents the highest yielding major asset class out there.
While the $10 billion per quarter of capital flooding into nontraded BDCs (at 100% of NAV) has caused direct lending spreads to compress to 475 to 500 bps over the past eighteen months, theoretically, the bear market in listed BDCs should cause inflows into the nontraded BDC to stop, and potentially even reverse, which could lead to less deployment pressure and therefore higher go-forward spreads.
2. Credit concerns:
Useful indicators of private credit loan stress are measurements of non-accruals and PIK income. While non-accruals have declined by around 40 bps over the past year, PIK income has increased by approximately 100 bps.

The data indicate that BDC portfolios signalled no broad credit issues through Q2 reporting this year (Q3 reports are expected to be released later this month and early November). BDCs provide excellent transparency because they are SEC filers and provide a 10-Q every 90 days detailing every loan in their portfolios.
In addition, the other two segments of the sub-investment grade credit market, broadly syndicated loans and high yield bonds, are showing very little sign of stress. Meanwhile, BDCs are indicating an imminent recession and substantial credit losses.

Regional banks provide a useful broad-based barometer of credit conditions in the U.S. economy. Currently, regional bank stocks have been trading well, indicating no signs of significant widespread credit issues.

Another indicator, private equity, which represents subordinated equity claims that are junior to private credit / BDCs, is showing positive returns this year. Popular evergreen private equity funds, which own the equity of companies likely financed by BDCs, are showing a double-digit positive return this year, along with positive monthly returns – in stark contrast to the widespread private equity losses implied by BDC’s negative performance this year.
Finally, even non-private-credit-focused BDCs have been caught in a wave of selling. There are 43 listed BDCs trading on the NYSE and NASDAQ. Of these, the vast majority focus on sponsor-backed direct lending (traditional private credit). A few focus on venture lending, while others have a hybrid private credit and private equity model. And one BDC falls outside of these categories, which makes it an interesting case study.
There exists one unique BDC that is not focused on private credit, venture debt, or private equity. Palmer Square Capital BDC (PSBD) holds a portfolio of broadly syndicated loans (BSLs). In contrast to nearly every other BDC, which has exclusively Level 3 assets, PSBD has all Level 2 assets, and therefore it can mark-to-market its loan portfolio fairly accurately. Given this underlying liquid portfolio, PSBD can (and does) provide a monthly NAV to investors, filed in an 8-K mid-month. Given the unique composition of its portfolio, it is the only BDC to disclose marked-to-market monthly NAVs. Since its IPO in January 2024, PSBD (blue line below) has traded in line with its underlying NAV, or the value of its underlying loan portfolio, (orange line below). Well, it did until the BDC market hit some major volatility beginning in March and picking up steam into April, in which PSBD’s price diverted materially from its NAV, and it traded down to a double-digit NAV discount. We can track market prices for a diversified BSL portfolio through the Blackstone Senior Loan ETF (SRLN, represented by the red line). It performs somewhat similarly to the PSBD NAV, although PSBD is leveraged and its yield is roughly 400 bps higher. That said, the BSL market has held up well over the past several months while the BDC market has melted down. Unlike most BDCs, PSBD is not private credit, but has still been caught in a vicious wave of BDC selling, despite its market focus (BSLs) holding up well. The market’s concerns about private credit loan books should not apply to PSBD. One year ago, PSBD traded in line with its NAV, as measured by a marked-to-market portfolio. After getting caught up in the BDC crash, it now trades at a -23.3% discount to NAV.

Source: Accelerate, Bloomberg, Company filings
Finally, some media outlets have conflated private credit and the broadly syndicated loan market with respect to the First Brands bankruptcy. First Brands did not rely on the private market, instead tapping the public loan market for financing. Therefore, the First Brands story is a public loan and collateralized loan obligation (CLO) story, with many BSL funds and ETFs affected by the First Brands bankruptcy, along with 517 CLOs. BDC exposure to First Brands is extremely limited, since they focus on traditional private credit – sponsor-backed direct lending.
3. AI will kill software:
Software is a top three industry for private credit loan books. BDCs like lending to software companies because they are non-cyclical. A thesis has spread recently that AI will kill software companies, which will presumably not only zero the equity in these “mission critical” business software companies, but impair the first lien loans as well. While AI does present a risk to software companies, along with an opportunity, we have not seeing significant pressure on the sector in terms of broad-based abandonment of business software. Remember, software-focused private credit loans finance software private equity buyouts. Meanwhile, the leading software PE firm Thoma Bravo has never been busier – recently announcing three large software leveraged buyouts (Dayforce, Verint Systems, and PROS Holdings) worth a total of $15.7 billion. PE firms are not showing any sign of AI destroying the software business.
In conclusion, BDCs have traded down on three fears, including declining interest rates, perceived credit issues, and AI disruption fears, such that the median BDC now trades at a -21% discount to NAV. Historically, buying BDCs at these prices has resulted in attractive returns to investors. In addition, private credit serves a role in diversified portfolios, and buying in the liquid market at 80 can make more sense than buying in the private market at 100. If one is allocated to a non-traded BDC, perhaps its a good time to make the switch and redeem at 100 to buy at 80.
A classic value investment in an equity market that remains short on them.
Accelerate manages five alternative investment solutions, each with a specific mandate:
- Accelerate Arbitrage Fund (TSX: ARB): Merger Arbitrage
- Accelerate Absolute Return Fund (TSX: HDGE): Absolute Return
- Accelerate OneChoice Alternative Multi-Asset Fund (TSX: ONEC): Multi-Asset
- Accelerate Canadian Long Short Equity Fund (TSX: ATSX): Long Short Equity
- Accelerate Diversified Credit Income Fund (TSX: INCM): Private Credit

ARB gained 1.2 % in September, compared with the benchmark S&P Merger Arbitrage Index’s 0.8% rise.
As discussed in Accelerate’s latest Merger & SPAC Monitor, We Are So Back, merger and special purpose acquisition company activity continues at a brisk pace, and the Fund is a beneficiary of this dynamic.
There were twenty-four M&A transactions, worth a total of nearly $150 billion, announced last month. Of these, the Fund invested in seven. In addition, there were fourteen SPAC IPOs that collectively raised an aggregate of $3.4 billion, and the Fund participated in six of them. We continue to see attractive average yields offered across the spectrum of new deals.
Currently, ARB is 156% long and -12.2% short (168.2% gross), with 72% allocated to SPAC arbitrage and 28% to traditional merger arbitrage (including 20% to strategic M&A and 8% to leveraged buyouts).
We are pleased to announce that the Accelerate Arbitrage Fund (TSX: ARB) has been awarded a Top 5 global hedge fund ranking in the Merger Arbitrage – Past Three Years category, as featured in the latest Barclay Managed Funds Report.
![]()

HDGE rose 4.2% amid a wild month for factor performance and a continued challenging environment for short selling.
Last month, overvalued and low-quality stocks skyrocketed, with top decile overvalued securities surging by 15.1%, while the top 10% most undervalued stocks had flat returns. In addition, the top 10% of lowest quality stocks jumped 14.2%, while the top decile highest quality stocks were flat in the U.S. Conversely, the long-short price momentum, operating momentum, and trend portfolios all notched significant gains during the month in both Canadian and U.S. markets, offsetting the losses in the market neutral value and quality portfolios.
Top Fund contributors for the month include a long position in Celestica, along with short positions in Sable Offshore and JELD-WEN. Top Fund detractors include short positions in Select Water Solutions, FormFactor, and Ivanhoe Mines.
![]()
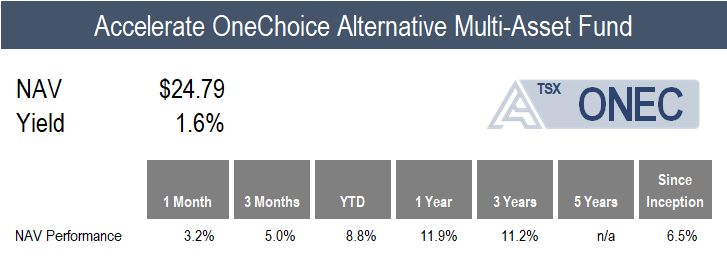 ONEC generated a 3.2% return in a month that saw broad-based positive performance from most asset classes.
Leading the pack was the Fund’s precious metals allocation, as gold rallied 11.5%. Following that, several of ONEC’s hedge fund strategies, including managed futures, long short equity, absolute return, and risk parity, generated returns of between 4.2% and 5.5%. ONEC’s commodities, real estate, and infrastructure allocations all produced returns of between 2.0% and 3.6%, while merger arbitrage and leveraged loans gained less than 2.0%. Conversely, the Fund’s diversified private credit portfolio declined amid deep negative investor sentiment, dropping -7.5% for the month.
![]()
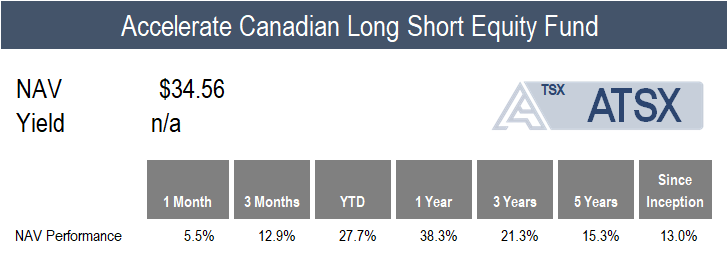
ATSX gained 5.5% in September, compared to the benchmark S&P/TSX 60’s 4.7% total return.
Canadian multi-factor performance was mixed last month, with the long-short value and quality portfolios underperforming, as overvalued and low-quality stocks skyrocketed. Conversely, the market neutral price momentum, operating momentum, and trend portfolios all generated positive alpha, offsetting the weakness in the value and quality factor returns, thereby buoying the Fund’s monthly performance.
Top Fund contributors for the month include long positions in Endeavour Mining, Barrick Mining, and Celestica. Top Fund detractors include short positions in Ero Copper, Endeavour Silver, and Ivanhoe Mines.
![]()
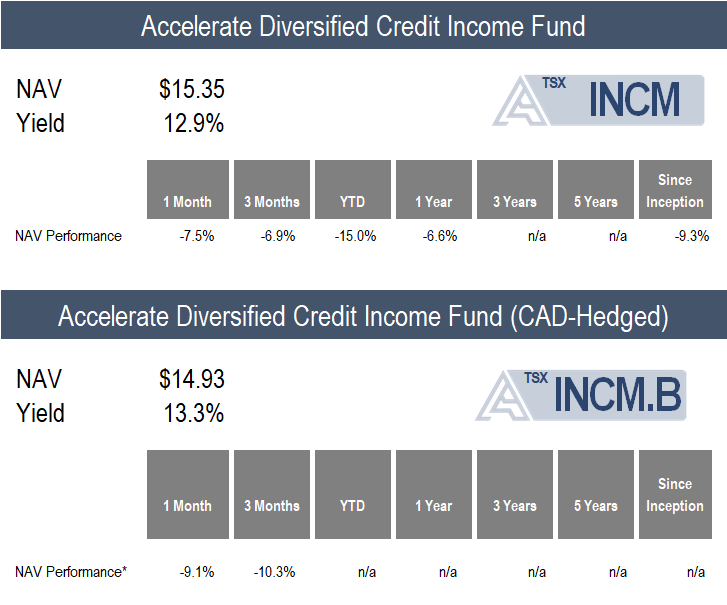
INCM declined by -7.5% in a challenging month for liquid private credit.
Significant negative sentiment has overwhelmed the listed BDC market, despite underlying credit conditions being generally satisfactory, causing NAV discounts to widen to levels wider than experienced at the April lows.
In our recent memo, The Credit Market Paradox: What’s Really Going On?, we discussed the recent pain in the liquid private credit market, which stands in stark contrast to other market segments: “On one hand, the junk bond, BSL, and regional bank markets have rebounded, more than recovering their April losses, indicating benign credit conditions and low U.S. recession odds. Conversely, the BDC / liquid private credit market has declined substantially, particularly over the past two-and-a-half weeks, signalling high U.S. recession odds and widespread defaults among private-equity backed companies. Note that approximately 85% of BDC loan portfolios are to sponsor-backed companies at an average loan-to-value of around 40%. Therefore, the significant and widespread price weakness and Net-Asset-Value discounts within the BDC secondary market pricing imply massive losses for private equity funds. Meanwhile, popular private equity evergreen funds have only shown consistent positive monthly returns this year. Also, BDC loan portfolio fundamentals have held up year-to-date through the second quarter.”
Currently, INCM is allocated to 20 listed private credit funds, which hold more than 5,000 loans and investments. Of these loans, 83.9% are secured and 90.3% are floating rate, with a weighted average yield of 12.9%. INCM currently trades at a -16.6% discount to the underlying net asset value of its loan pools.
![]()
Have questions about Accelerate’s investment strategies? Click below to book a call with me:

-Julian
Disclaimer: This distribution does not constitute investment, legal or tax advice. Data provided in this distribution should not be viewed as a recommendation or solicitation of an offer to buy or sell any securities or investment strategies. The information in this distribution is based on current market conditions and may fluctuate and change in the future. No representation or warranty, expressed or implied, is made on behalf of Accelerate Financial Technologies Inc. (“Accelerate”) as to the accuracy or completeness of the information contained herein. Accelerate does not accept any liability for any direct, indirect or consequential loss or damage suffered by any person as a result of relying on all or any part of this research and any liability is expressly disclaimed. Past performance is not indicative of future results. Visit www.AccelerateShares.com for more information.

