


September 14, 2025 – The “Roaring Twenties” represented a period of rapid industrial growth around one hundred years ago, underpinned by the development and adoption of life-changing technological innovations including automobiles, radios, and electricity. Between 1921 and 1929, the U.S. stock market, as measured by the Dow Jones Industrial Average, rose nearly 6x. It was the mother of all bull markets.
Many stocks traded at extremely high price-to-earnings ratios, detached from their underlying company fundamentals. Granted, not many cared about valuations during that era, as fundamentals-based investing had not yet emerged as a mainstream investing framework. Primarily, speculators were betting on continued price increases rather than intrinsic value, supported by the copious use of margin debt, which had reached unprecedented levels.
At the time, Yale University economist Erving Fisher was one of the leading authorities on economics and monetary theory. During a speech on October 15, 1929, Fisher commented on the surging U.S. stock market that was the hallmark of the Roaring Twenties. During that period, while few probably noticed, given the limited market infrastructure and data available, U.S. equities were at their highest valuations on record.
“Stock prices have reached what looks like a permanently high plateau,” Fisher exclaimed. “I do not feel there will soon, if ever, be a fifty or sixty point break from present levels, such as [bears] have predicted. I expect to see the stock market a good deal higher than it is today within a few months.”
Just nine days after Fisher’s poorly-timed bullish forecast, the “Black Thursday” market decline marked the start of a dramatic collapse in stocks and the start of the Great Depression. Between 1929 and 1932, U.S. stocks declined by nearly -90%. The Dow did not surpass its September 1929 closing high until November 1954. That is a 25-year wait for investors to see the index return to its previous record, a period longer than most investment horizons.
It would be another 70 years until another raging bull market, supported by a new market economy highlighted by the emergence of the internet, in which U.S. stocks would match the record valuation levels reached at the peak of 1929, right before the Great Depression.
Coincidentally, those record valuations reached in 1999 also preceded a nasty bear market. It took more than seven years for the S&P 500 to surpass its tech bubble peak, as investors suffered a -50% peak-to-trough drawdown from early 2000.
There is a famous quote from legendary investor Sir John Templeton: “The four most dangerous words in investing are: ‘this time it’s different.’”
With tongue planted firmly in cheek, given the current market environment, I often say that the twelve most dangerous words in investing are “The four most dangerous words in investing are: ‘this time it’s different.’”.
Maybe things will not repeat as they have in the past. While stock valuations have mean-reverted in the past, there is no guarantee that they must.
Nevertheless, it is worthwhile noting that U.S. stocks have reached a new record valuation, exceeding those levels reached in both 1929 and 1999.

It is not just U.S valuations that are extremely rich. Globally, the All Country World Index (ex. U.S.) is at its 90th percentile valuation. Most stock markets around the world are richly valued, particularly the American market. That said, investors can still find pockets of more reasonably priced stocks, particularly those in Japan, Europe, and the United Kingdom.

Stock market valuations provide a guidepost as to what future returns may bring. Historically, low valuations have resulted in above average historical returns, while conversely, high valuations have resulted in lower than average returns. Several times throughout history, record stock market valuations were reached just before devastating bear markets in which stocks fell precipitously.
Currently, valuations, particularly for U.S. equities, have never been higher by certain measures. Moreover, global equity valuations are also at extreme levels.
While stock market valuations are helpful in guiding investor expectations over the long term and hence, provide a valuable input for asset allocation, over the short term, investor sentiment and positioning may also prove useful.
Investor sentiment readings aim to capture the consensus view on the short term prospects for the stock market. It can serve as a contrarian indicator because markets often move ahead of fundamentals, and human psychology tends to overshoot in both directions. When things are well, investors tend to believe that the good times will continue forever. When things are bad, investors can become hopeless and think that poor market conditions will persist far into the future.
When most investors crowd into the same emotional framework, either overly bullish or too bearish, that consensus positioning can signal that market prices already reflect the prevailing view.
When surveys show overwhelming investor optimism, most market participants are already long stocks, meaning the remaining buying power is mostly exhausted. Stocks roll over when there are no remaining incremental buyers to push prices higher. When investor pessimism dominates, many investors have already exited the market, leaving few sellers remaining.
With overly bullish sentiment, any economic disappointment or negative catalyst can trigger selling, causing prices to correct. Meanwhile, if sentiment is predominantly bearish, even modest positive news can spark a short-covering rally.
One would typically expect surging investor sentiment to occur in parallel with equity valuations hitting record highs. Bull markets tend to lift investor sentiment in several reinforcing ways, with a positive feedback loop of optimism, confidence and risk-taking. Portfolio gains make investors feel wealthier, supporting a positive outlook and underwriting increased risk taking. As they say, “the trend is your friend until it ends,” and a positive trending market attracts capital, further pushing up prices. No one likes getting off the ride as it starts getting fun.
In a bull market, price strength breeds optimism.
Ironically, as the stock market has surged since its April low, specific sentiment indicators are signalling that investors are currently apathetic, even somewhat despondent. Average investor sentiment currently stands fairly neutral. The Goldman Sachs U.S. Equity Sentiment Indicator suggests mildly bearish or cautious positioning among investors.

The American Association of Individual Investors bull-bear spread measures sentiment weekly from a survey, asking respondents if they are bullish, bearish, or neutral about the stock market over the next six months. Currently, the bull-bear spread was about −21.45%, indicating that more respondents were bearish than bullish .

Sentiment indicators signal a bearish tilt in the average investor’s outlook, however, FOMO (fear of missing out) does not appear to be widespread.
While U.S markets stand at all-time high valuations, now exceeding levels reached at the peaks of 1929 and 1999, investors remain somewhat indifferent. Despite the surge in stocks over the past five months, investor sentiment remains measured.
Things could be different this time, and stocks may have reached a permanently high plateau as Fisher believed in 1929. Conversely, things could remain the same, and this bull market could continue, with record valuations continuing to rise. At the end of the day, there is nothing to prevent stocks from reaching ever higher valuations.
In any event, investor caution is warranted. While investor sentiment and positioning do not signal any potential near-term hiccups, record stock market valuations should give allocators pause, as historically below average returns have followed. Diversify accordingly.
Accelerate manages five alternative investment solutions, each with a specific mandate:
- Accelerate Arbitrage Fund (TSX: ARB): Merger Arbitrage
- Accelerate Absolute Return Fund (TSX: HDGE): Absolute Return
- Accelerate OneChoice Alternative Multi-Asset Fund (TSX: ONEC): Multi-Asset
- Accelerate Canadian Long Short Equity Fund (TSX: ATSX): Long Short Equity
- Accelerate Diversified Credit Income Fund (TSX: INCM): Private Credit

ARB declined -0.4% in August, compared to the benchmark S&P Merger Arbitrage Index’s 1.5% gain.
The Fund’s underperformance last month was primarily due to the widening of SPAC arbitrage spreads, as SPAC yields rose from 3.7% to 4.3%.
In August, twenty-nine public M&A deals were announced in the U.S. and Canada. Of these, the Fund invested in three merger arbitrage opportunities. Also, of the eight SPAC IPOs last month, ARB invested in five.
ARB is currently 142.7% long and -11.2% short, equating to 153.9% gross exposure, with 73% allocated to SPAC arbitrage and 27% to merger arbitrage (of which 17% is strategic M&A and 10% is leveraged buyouts).
![]()

HDGE had a fairly uneventful month with a -0.4% return, amid mixed to negative North American long-short factor performance.
In particular, U.S. market neutral quality, price momentum, operating momentum, and trend portfolios generated a negative return in August, offset solely by positive alpha from the U.S. long-short value portfolio. Low-quality, overvalued, and heavily shorted stocks continued their outperformance this year, challenging overall Fund performance.
Top Fund contributors for the month include a long position in Kinross Gold, along with short positions in Six Flags Entertainment and Snap. Top Fund detractors include short positions in NeoGenomics, Jeld-Wen, and Albemarle.
![]()
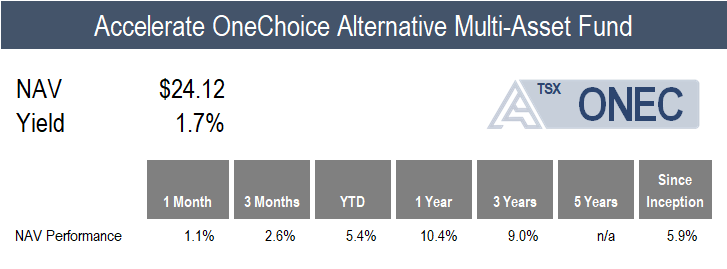
ONEC generated a 1.1% return last month, with positive performance stemming from the majority of the alternative strategies allocated within the Fund’s multi-asset framework.
The Fund’s long short equity allocation led the pack with a 6.9% gain. Meanwhile, ONEC’s allocation to gold continues to drive performance, as the precious metal added 3.9% to the Fund’s monthly tally. Additionally, risk parity, real estate, managed futures and commodities allocations generated returns of 1-3% for the month. Lastly, the leveraged loan and infrastructure portfolios produced modest positive performance.
On the other hand, ONEC’s allocations to absolute return, merger arbitrage, and private credit detracted from performance, yielding returns of -0.4%, -0.4%, and -1.9%, respectively.
![]()
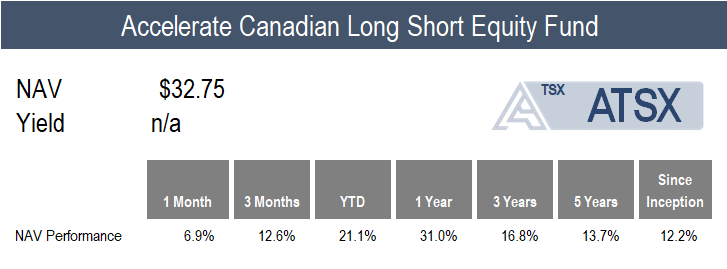
ATSX gained 6.9% in August, compared to the benchmark S&P/TSX 60’s 4.8% return.
The Fund’s monthly return was supported by positive Canadian multi-factor portfolio performance for the month. While the long-short value and quality portfolios generated a negative return, as overvalued and low-quality stocks outperformed undervalued and high-quality equities, this was more than offset by the positive performance contribution of the long-short operating momentum and trend portfolios.
Top Fund contributors for the month include long positions in Kinross Gold, Barrick Mining, and Pan American Silver. Top Fund detractors include short positions in Equinox Gold, Capstone Copper, and NexGen Energy.
![]()
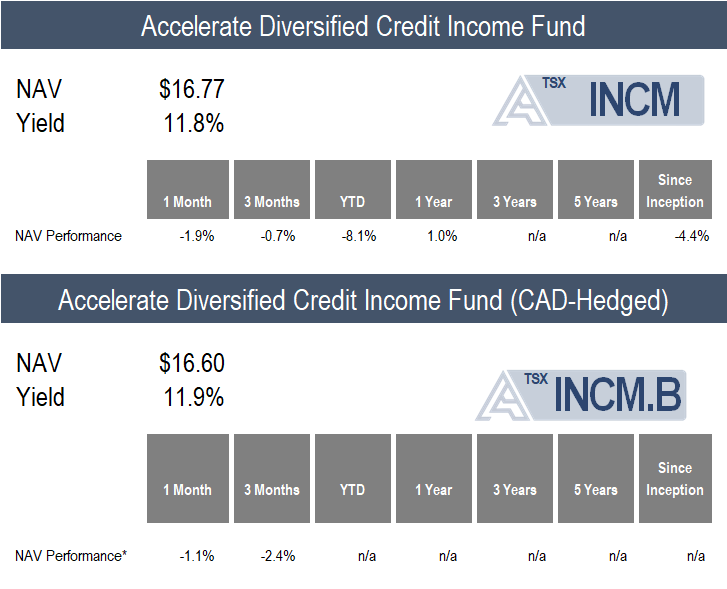
INCM declined -1.9% for the month (-1.1% in CAD terms).
By mid-August, all of the Fund’s private credit allocations had reported their second quarter financial results. As detailed in our latest memo, Accelerate Liquid Private Credit Monitor – A Tale of Two Markets, private credit fundamental performance remained relatively stable, in contrast to poor average market price performance. As noted in the memo, “The average of the liquid private credit funds listed below generated a -2.6% quarterly total return (-10.2% annualized) based on market values plus dividends, a stunning contrast to the positive fundamental performance of 6.8% annualized of the underlying loan portfolios over the same period.”
Currently, INCM is allocated to twenty liquid private credit funds, which trade at a weighted average discount to NAV (or the value of their loan portfolios) of -10.3%. The Fund’s portfolio consists of more than 4,000 loans, of which 87.3% are senior secured and 94.1% are floating rate loans, with an average underlying yield of 12.0%.
![]()
Have questions about Accelerate’s investment strategies? Click below to book a call with me:

-Julian
Disclaimer: This distribution does not constitute investment, legal or tax advice. Data provided in this distribution should not be viewed as a recommendation or solicitation of an offer to buy or sell any securities or investment strategies. The information in this distribution is based on current market conditions and may fluctuate and change in the future. No representation or warranty, expressed or implied, is made on behalf of Accelerate Financial Technologies Inc. (“Accelerate”) as to the accuracy or completeness of the information contained herein. Accelerate does not accept any liability for any direct, indirect or consequential loss or damage suffered by any person as a result of relying on all or any part of this research and any liability is expressly disclaimed. Past performance is not indicative of future results. Visit www.AccelerateShares.com for more information.

