


March 15, 2026 – The world economy is experiencing a global oil supply shock that has a myriad of potential market implications.
This shock is due to the recent closure of the Strait of Hormuz, the narrow maritime passage connecting the Persian Gulf to the Arabian Sea.
The strait, which is just 34 kilometers wide at its narrowest point, is the world’s most important oil transit chokepoint. Most Middle Eastern oil exporters, including Saudi Arabia, Iraq, Kuwait, the UAE, and Iran, rely on the strait to export their oil production, primarily to Asia. Approximately 20 million barrels per day of crude oil and condensate, representing around 20% of global consumption, move through the strait. It is strategically vital for the ordinary functioning of the global economy.
Currently, the strait is effectively closed to commercial shipping due to the U.S.-Israeli war with Iran, whose threats of attacks on tankers have halted all tanker traffic through the channel.
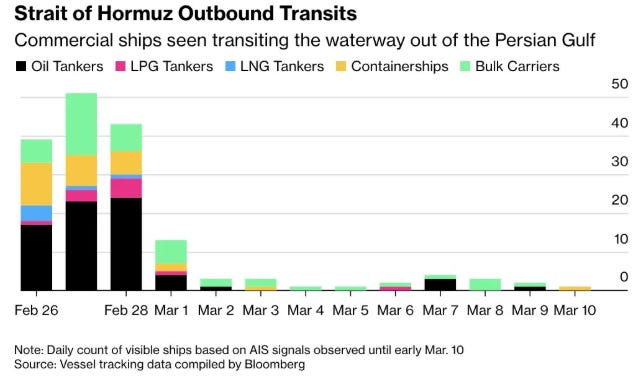
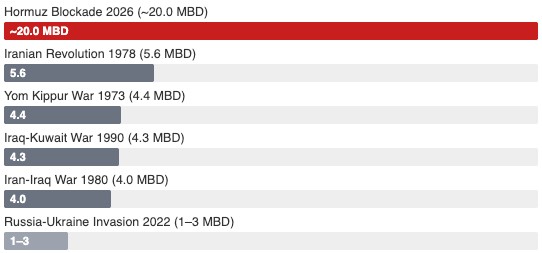
The closure of the Strait of Hormuz, now over two weeks old, marks the most severe supply disruption to the global oil market in history. With 20 million barrels per day effectively coming off the market, the current oil supply shock is multiples greater than previous geopolitical conflicts, including Russia’s recent invasion of Ukraine.
Source: https://www.derekthompson.org/
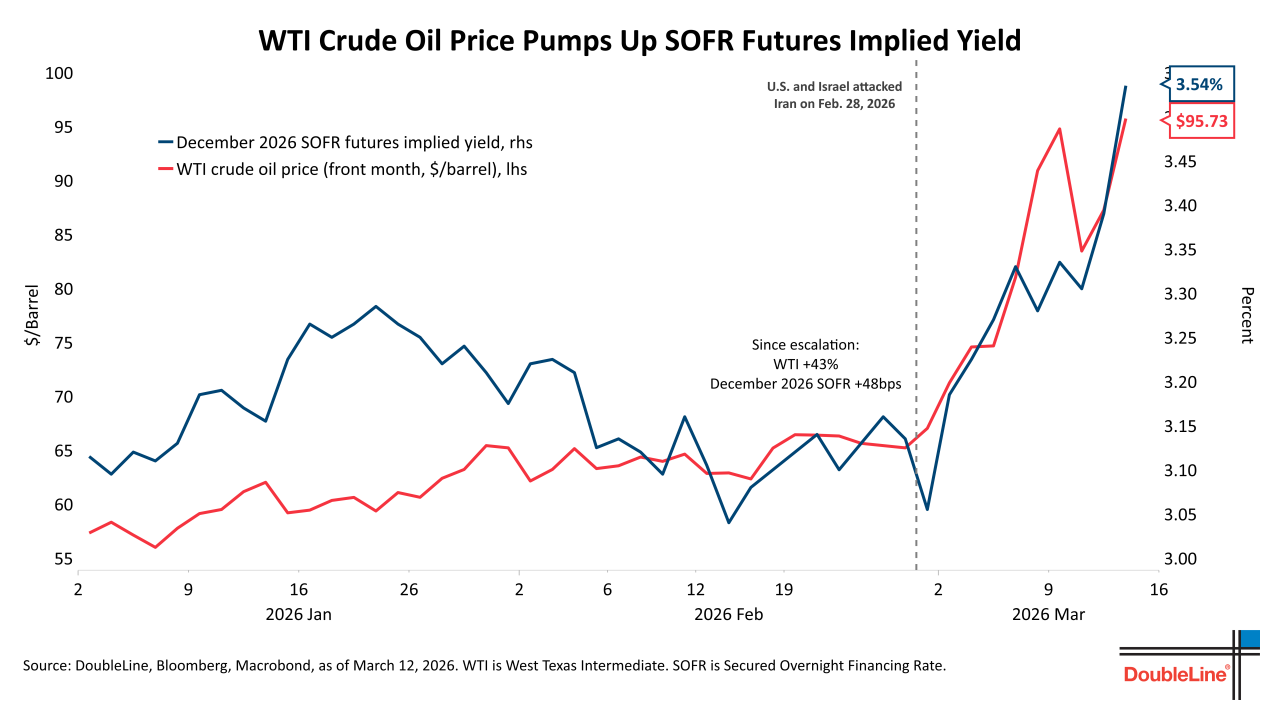
The most immediate impact of the supply shock is a sharp increase in oil prices. Since the war broke out on February 28th, the price of Brent crude (the global benchmark) has surged by 43.7%. Moreover, prices began to move in anticipation of the conflict, with global oil prices having spiked by 72.4% year-to-date.
Oil flows through the supply chains of nearly every product on Earth, with its most direct impact on fuel prices. The price at the pump for gasoline has surged accordingly. In addition, consumer sentiment, which was already under pressure, is set to further decline in lock-step with the rise in price of gas.
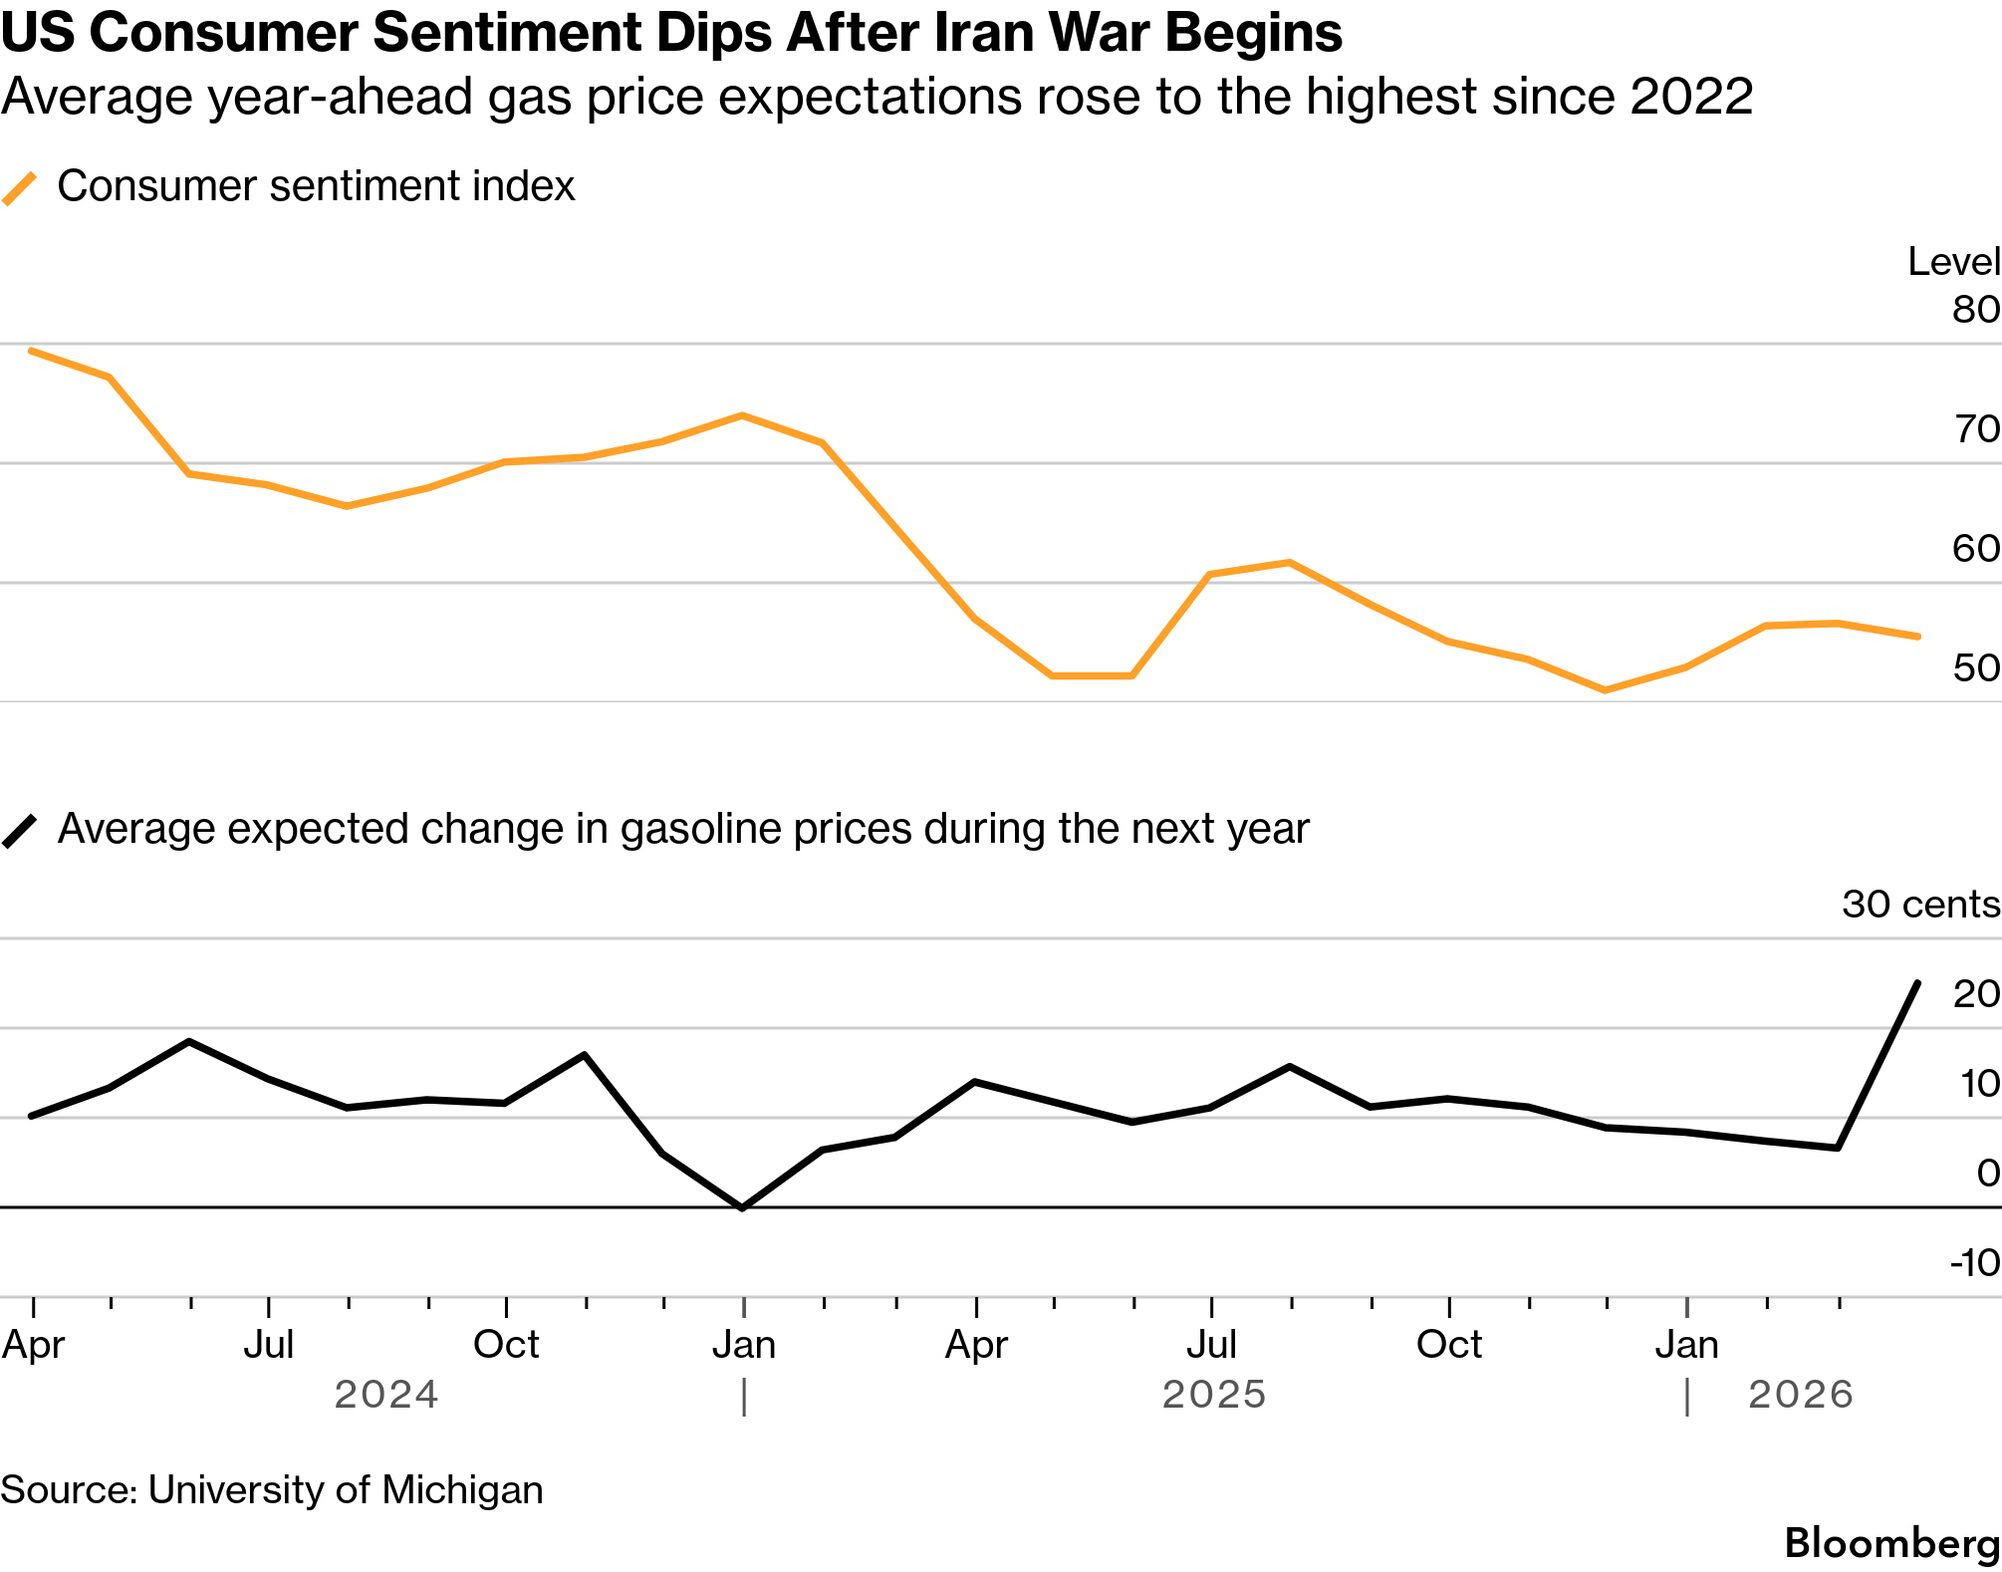
There are few things more painful to consumers than a spike in gas prices. To make matters worse, fertilizer prices have surged, which will have knock-on effects on the price of food. The second-order effects of the increase in oil prices are significant and far-reaching.
As fuel prices have risen, inflation expectations have increased as a result. The rise in inflation expectations has driven interest rate futures up.
Consequently, December interest rate futures have increased by approximately 50bps this month to over 3.5%, forecasting that there will be no interest rate cuts from the Federal Reserve this year.
Currently, the much-anticipated two interest rate cuts from the Fed, previously pencilled in for mid-2026, are likely to be pushed out to 2027, if they happen at all.
Speculators have made the most of the volatility in the crude oil market by ramping up day trading of the popular United States Oil Fund ETF. Daily volume of the ETF reached nearly $16 billion at its peak trading frenzy last week, by far a record tally and more than 20-fold its average trading volume.
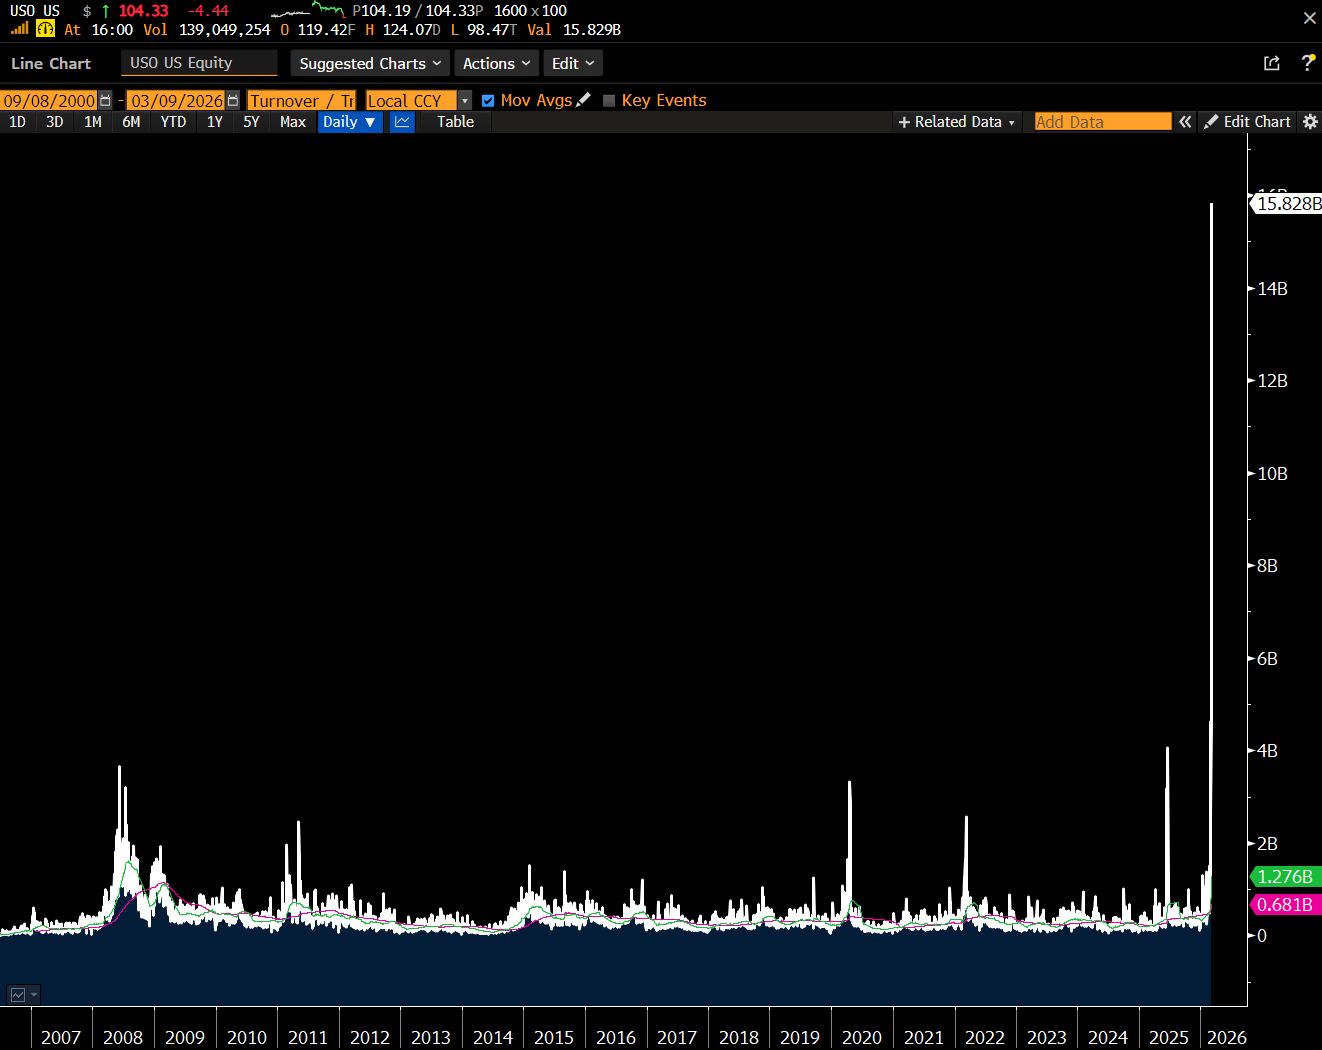
Source: Bloomberg
In addition to the price of fuel and its implications for inflation and interest rates, global risk premia have increased, and equities have come under pressure (except for oil producers, who have seen their stock prices rally). U.S. Treasury bonds, historically a safe haven amid geopolitical and market strife, have also sold off due to the rise in interest rates. The only safe havens for investors during this volatile period have been the U.S. dollar and commodities, as well as energy equities,
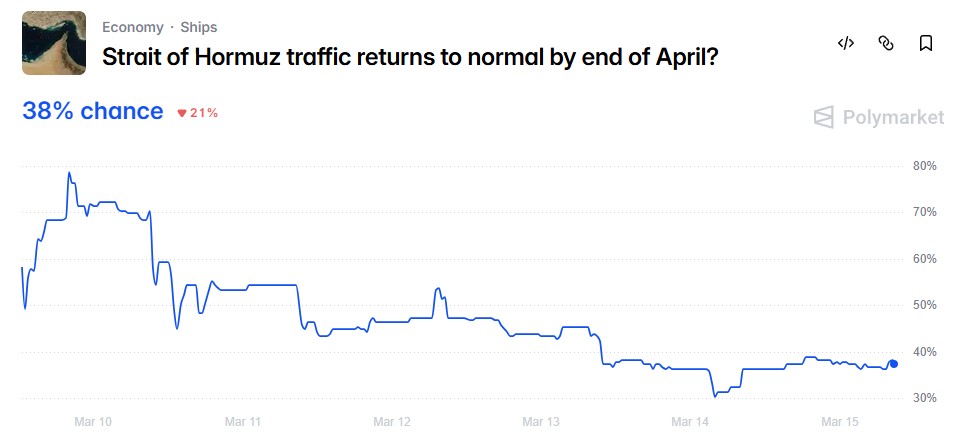
This oil supply shock and its accompanying surge in the price of oil will prove transitory. For now, the market waits with bated breath for the war in Iran to conclude and the Strait to reopen. Currently, betting markets are forecasting a less than a 50% chance of normalized activity through the Strait by the end of April.
Once shipments of crude oil resume and the supply of energy normalizes, much of the recent market action will reverse – the price of oil will sink, risk assets will rally, inflation will decline, and rate cuts will be back on the table. As for when that happens, it’s anyone’s guess. Until then, we’ll continue to see crude consequences.
Accelerate manages five alternative investment solutions, each with a specific mandate:
- Accelerate Arbitrage Fund (TSX: ARB): Merger Arbitrage
- Accelerate Absolute Return Fund (TSX: HDGE): Absolute Return
- Accelerate OneChoice Alternative Multi-Asset Fund (TSX: ONEC): Multi-Asset
- Accelerate Canadian Long Short Equity Fund (TSX: ATSX): Long Short Equity
- Accelerate Diversified Credit Income Fund (TSX: INCM): Private Credit
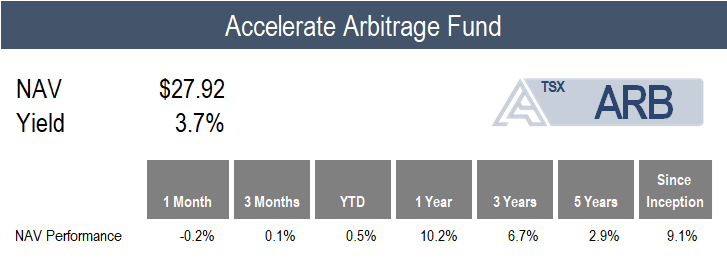
ARB declined -0.2% in February as arbitrage spreads widened slightly.
Last month, there were 27 SPAC IPOs, of which the Fund participated in 19. Meanwhile, there were just two SPAC business combinations announced, making for a fairly boring blank check market. SPAC arbitrage yields increased 40bps from 3.3% to 3.7% as the market digested the flood of supply.
The merger arbitrage market was far more exciting in February, with 25 M&A deals announced in North America totalling more than $125 billion. Moreover, a bidding war broke out for Fund investment Janus Henderson Group, after it received an unsolicited proposal from Victory Capital at $57.04 per share – a price 16.4% above Trian’s friendly $49.00 bid. We look forward to the resolution of this emerging bidding war.
Currently, ARB is 160.4% long and -4.2% short (164.6% gross exposure), with 71% allocated to SPAC arbitrage and 29% to merger arbitrage (with 14% in LBOs and 15% in strategic M&A).
![]()

HDGE gained 5.8% in February, driven by tailwinds for multifactor strategies, as the Fund’s long portfolio outperformed and its short portfolio underperformed.
Multifactor long short equity performance was the strongest we have seen in many months, primarily driven by price momentum and trend factors. Not only did every U.S. factor portfolio generate alpha, but every top decile factor portfolio generated positive returns while nearly every bottom decile factor portfolio generated negative returns. Meanwhile, the GS Most shorted basket fell -4.5% for the month, buoying hedged strategies.
Top Fund contributors include short positions in Insperity, Rapid7, and ACV Auctions. Top Fund detractors include long positions in Fox Corporation and Medpace Holdings, as well as a short position in Freshpet.
![]()

ONEC generated a 4.3% in February – a month in which most of the Fund’s alternative asset allocations produced strong returns.
The Fund’s top contributor was long short equity, which increased by 10.8%, followed by infrastructure, which gained 9.1%, and real estate, which surged by 8.7%.
Additional positive contributors for the Fund’s monthly return include managed futures, absolute return, risk parity, gold, and commodities, which gained 8.0%, 5.8%, 5.2%, 4.8%, and 3.5%, respectively. The Fund’s arbitrage allocation fell slightly.
The only major detractor from performance was the Fund’s credit allocation, as broadly syndicated loans fell by -1.8% and private credit declined by -8.6%.
![]()
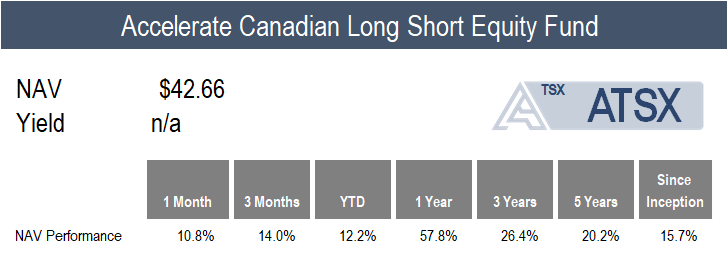
ATSX gained 10.8% in February compared to the benchmark S&P/TSX 60’s 6.6% return.
The majority of Canadian long short factors generated alpha last month, except for value, which declined slightly. The majority of the positive multifactor performance was due to the long short price momentum and trend portfolios.
Top Fund contributors include long positions in Fortuna Mining, Agnico Eagle Mines, and OceanaGold. Top Fund detractors include short positions in Perpetua Resources, Skeena Resources, and Northland Power.
![]()
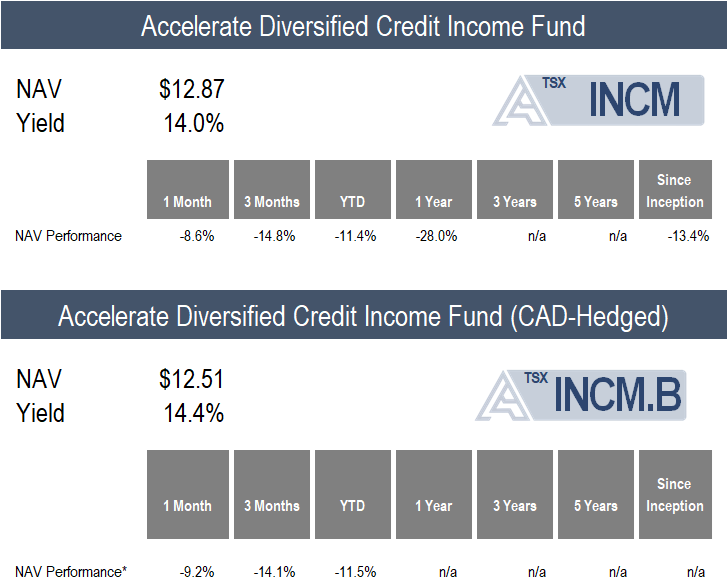
INCM declined by -8.6% over the month, amid continued headwinds for private credit.
Bearish sentiment around private credit’s exposure to software loans caused NAV discounts to widen further, such that the median listed BDC trades at a -26% discount to it net asset value, a level only seen in late 2008/early 2009 and spring of 2020.
Currently, INCM is allocated to 20 private credit portfolios (through listed BDCs), accounting for more than 5,000 loans and investments, of which 85.4% are senior secured and 91.1% are floating rate. The current yield on the INCM portfolio is 12.8%, and it trades at a -24% discount to its net asset value. INCM’s exposure to software loans is 16.4% of its portfolio.
![]()
Have questions about Accelerate’s investment strategies? Click below to book a call with me:

-Julian
Disclaimer: This distribution does not constitute investment, legal or tax advice. Data provided in this distribution should not be viewed as a recommendation or solicitation of an offer to buy or sell any securities or investment strategies. Please read the relevant prospectus before investing. For a summary of the risks of an investment in the Accelerate ETFs, please see the specific risks set out in the prospectus. ETFs are not guaranteed and the information in this distribution is based on current market conditions and may fluctuate and change in the future. Past performance is not indicative of future results. Decisions regarding tax, investments, and all other financial matters should be made solely with the guidance of a qualified professional. Visit www.AccelerateShares.com for more information.

