
January 19, 2026 – Several decades ago, prominent institutional investors had somewhat primitive investment portfolios, primarily focused on Government bonds.
For example, in the early 1990s, the Canada Pension Plan (now one of the world’s most preeminent and sophisticated institutional investors), did not allocate to private equity, hedge funds, or real estate. In fact, it did not even invest in equities. Back then, the Canada Pension Plan invested exclusively in federal and provincial bonds. Given that this basic investment portfolio was not diversified and lacked attractive risk-reward characteristics, it delivered sub-market returns and left the pension plan vulnerable to demographic pressures as its beneficiaries aged and its liabilities increased.
At this time, actuarial projections showed that the Canada Pension Plan, in its existing form, was unsustainable. To combat this issue, in 1997, sweeping government reforms created the Canada Pension Plan Investment Board (CPPIB). CPPIB, now known as CPP Investments, began operations in 1999 with a clear mandate to maximize long-term investment returns without undue risk.
The pension transitioned to primarily investing in public stocks and bonds, with a strong passive tilt. The approach was grounded in basic strategic asset allocation (SAA), which typically features a 60% stock allocation and a 40% bond allocation or some variant – an approach that many investors continue to rely on today. At the time, strategic asset allocation, in which a portfolio is based on a long-term target mix of asset classes, was steadily gaining popularity.
Since then, asset allocation has evolved from a rigid, siloed exercise in which asset classes are benchmarked and bucketed without consideration for overall portfolio contributions, into a far more dynamic and integrated discipline. Traditional strategic asset allocation constructed portfolios around fixed policy weights and somewhat limited asset class considerations, most commonly a static mix of public equities and bonds. This static, two-asset mix relied on assumptions about diversification, correlations, and long-run risk premia that held reasonably well across most macro environments. However, this approach can fall apart in inflationary environments in which both stocks and bonds decline in a positively correlated manner – similar to what occurred in 2022. As a result, alternative investments, real assets, private markets, factor exposures, and explicit risk budgeting have increasingly been layered into portfolios. Meanwhile, correlations have proven less reliable precisely when diversification is needed most. In addition, the advent of uncorrelated alternative asset classes, increased liquidity, and deeper capital markets have pushed investors to expand beyond just one or two-asset portfolios.
These shifts have set the stage for the emergence of the total portfolio approach (TPA), which reframes asset allocation decisions around underlying sources of risk and return, flexibility across implementation vehicles, liquidity management, and the efficient use of capital rather than adherence to traditional asset class boundaries.
As capital markets and portfolio management have evolved, sophisticated allocators have migrated from basic investing frameworks or strategic asset allocation to a total portfolio approach. Ultimately, the total portfolio approach represents an evolution from strategic asset allocation, moving from static asset class silos in favour of a goal-oriented view of the portfolio, enabling the addition (or subtraction) of assets based on their overall contribution to the portfolio. Under TPA, capital is allocated (and risk is budgeted) to the assets that add the optimal incremental contribution of risk and return to the portfolio. Each portfolio allocation decision must be justified by its contribution to the portfolio’s ability to achieve its goals, and each allocation competes for capital based on its marginal contribution.
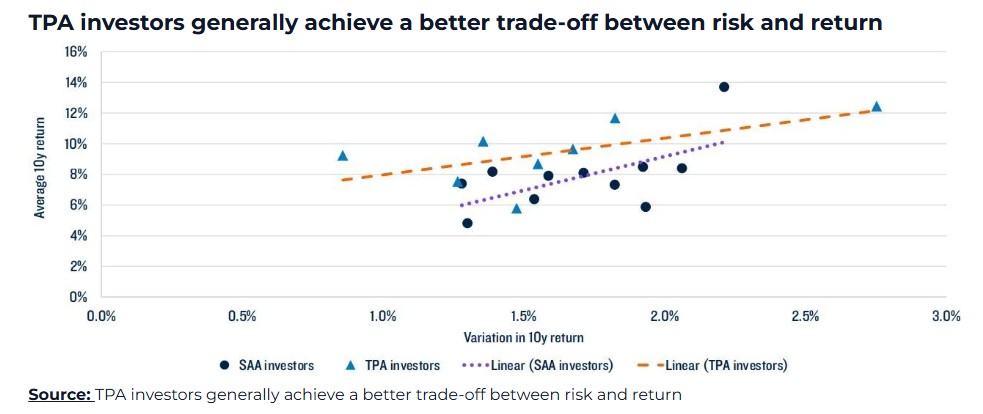
Where the success of strategic asset allocation is measured by relative value added compared to a benchmark, the success of the total portfolio approach is determined by whether portfolio return and risk targets are attained. According to a study by the consultancy Willis Towers Watson, TPA funds outperformed SAA funds by 1.8% annually over a ten year measurement period.
Moreover, TPA enables capital allocators to identify emerging risks and unintentional portfolio concentration. For example, a rapidly growing sector such as artificial intelligence may encompass exposures across equities, fixed income, private credit, and private equity. Different asset classes can load on the same risks. Under the total portfolio approach, concentrated portfolios and single risk factors can be diversified; however, these issues may remain concealed when using the strategic asset allocation, potentially leading to undesirable results.
Instead of solely measuring risk by individual asset class, TPA focuses on portfolio volatility and drawdowns, while tracking portfolio-level liquidity and exposure to macro factors such as growth, interest rates, and inflation. Under TPA, an investment is deemed attractive only if it improves the portfolio’s overall risk-adjusted return profile, even if that asset appears unattractive on a standalone basis.
As a result, TPA portfolios tend to include additional diversifiers such as trend-following CTAs, insurance-linked securities, or precious metals, which a plain-vanilla SAA might exclude. This additional diversification generally leads to higher risk-adjusted returns.
While public equities and public fixed income still make up a majority of the asset allocation, the portfolio has been populated with additional asset classes, including private equity, private credit, real assets (real estate and infrastructure), and absolute return strategies (hedge funds). In addition, its total portfolio approach utilizes capital-efficient leverage, which may not be appropriate for all investors.
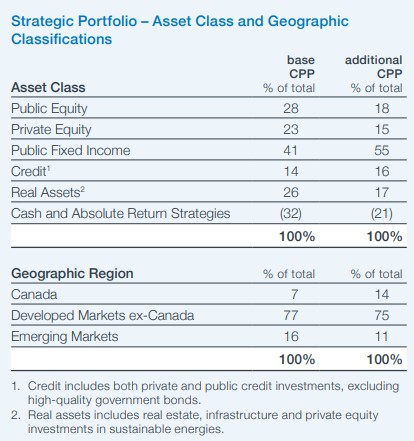
Source: CPP Investments
TPA is increasingly adopted among large institutional investors. With the emergence of a myriad of new liquidity options across various alternative asset classes, along with the endless innovation in capital markets, the total portfolio approach has never been easier to implement. Consequently, the total portfolio approach has seen increasing adoption across wealth managers and even individual investors.
That said, each investor has their own risk, return, and liquidity requirements. Accordingly, the total portfolio approach must be driven by these constraints, and thus resulting portfolios under TPA may look substantially different from other allocators’ portfolios. For example, a pension fund’s sizeable private asset exposure may be inappropriate for a wealth manager, given the contrasting liquidity requirements and timeframes.
Irrespective of the size of one’s investment portfolio, the core tenet of the total portfolio approach provides a logical roadmap to portfolio construction. Every investment decision should be evaluated by how it improves the risk-adjusted return of the entire portfolio, and not whether it fits into a specific asset class box. The total portfolio approach represents a fundamental evolution away from traditional strategic asset allocation and toward outcome-driven portfolio construction. TPA replaces asset class thinking with risk and return thinking.
While each allocator’s TPA may result in a dramatically different portfolio construction, what remains uniform is the holistic approach to a goal-oriented investment portfolio, in which each asset competes for capital and is driven by risk factors and risk budgeting, with a focus on total return and diversification.
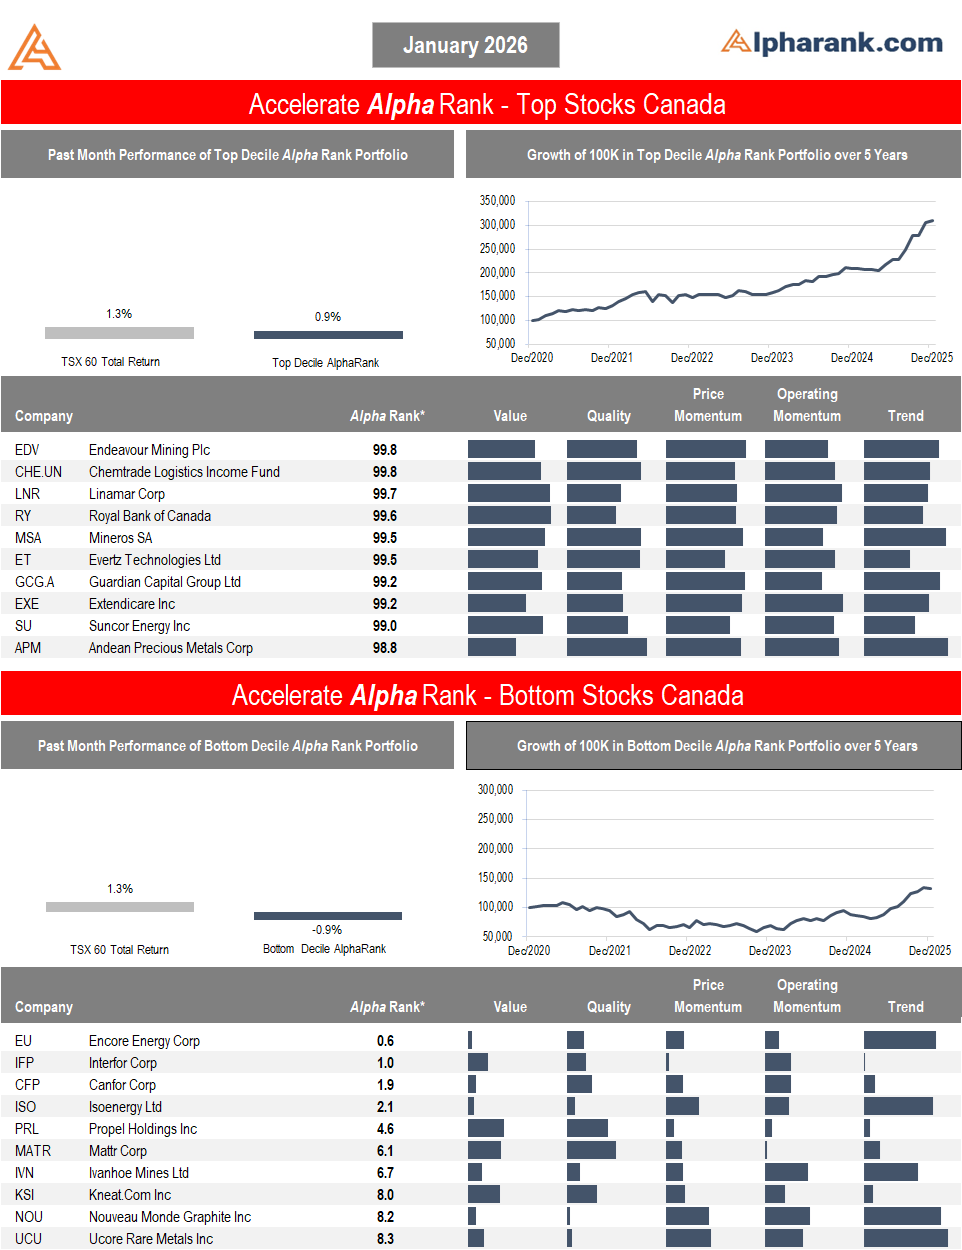
One small component of the total portfolio approach is a systematic long short equity exposure. To help facilitate the construction of a long short equity strategy, we highlight one top-decile stock that is forecasted to outperform and one bottom-decile stock that is predicted to underperform in this month’s AlphaRank Top Stocks.
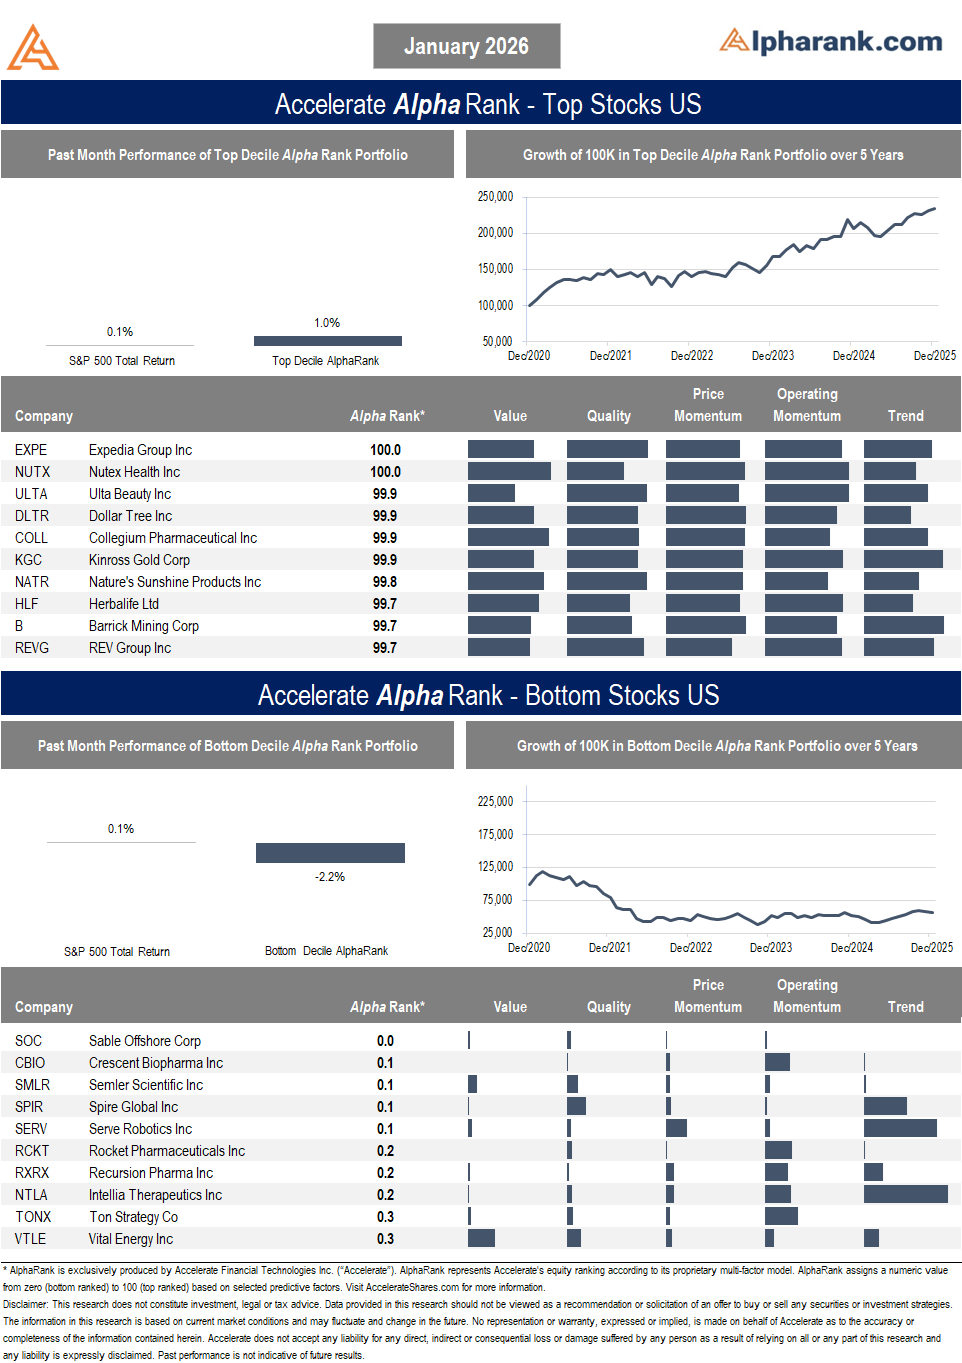
OUTPERFORM: Dollar Tree Inc (NASDAQ: DLTR) is one of the largest discount retail chains in the U.S., known for selling a broad assortment of everyday consumer goods at low prices. The company has recently raised its earnings guidance while beating quarterly expectations. DLTR stock remains attractively valued, trading at 8.3x EBITDA. Meanwhile, the company continues to repurchase shares, reducing its shares outstanding by -6.7% year-over-year. The company’s attractive 43.6% return on capital showcases its capital efficiency and high quality nature. With positive share price momentum, along with an AlphaRank score of 99.9/100, we expect DLTR shares to continue to outperform. Disclosure: Long DLTR shares in the Accelerate Absolute Return Fund (TSX: HDGE).
UNDERPERFORM: Sable Offshore Corp (NYSE: SOC) is an independent U.S. oil and gas company. It owns offshore drilling platforms, federal leases and subsea pipelines primarily in federal waters off California, and its core business is restarting oil production from these assets after buying them from ExxonMobil in 2024. The company faces ongoing regulatory and legal uncertainty. California regulators and environmental groups have repeatedly challenged Sable’s permits and operations, and although there have been some federal regulatory decisions in its favour, litigation and political opposition remain unresolved and could delay or thwart commercial production for significant periods. Sable has reported large net losses, including over $110 million in a quarter, as it invests heavily in restarting production and dealing with operational costs. Its balance sheet shows very high debt relative to equity and limited liquidity, which means the company may need to raise additional capital or refinance debt on potentially unfavourable terms, diluting shareholders. With an AlphaRank score of 0.0/100 (the lowest rank in our model), we expect SOC shares to continue to underperform.
The AlphaRank Top and Bottom stock portfolios exhibited positive relative performance last month:
- In Canada, the top-ranked AlphaRank portfolio of stocks gained 0.9%, underperforming the benchmark’s 1.3% return, while the bottom-ranked portfolio of Canadian equities fell by -0.9%. The long-short portfolio (top minus bottom ranked stocks) increased by 1.8%, as the top-ranked stocks outperformed the bottom-ranked securities. Over the past five years, the top decile AlphaRank portfolio has gained more than 200%, while the bottom-ranked portfolio has risen less than 50%.
- In the U.S., the top-decile-ranked equities rose by 1.0%, outperforming the S&P 500’s 0.1% return. Meanwhile, the bottom-ranked stocks fell by -2.2%, resulting in a 3.2% return for the top decile minus the bottom decile long-short portfolio. Over the past five years, the top-ranked U.S. equities have gained nearly 150%, while the bottom-ranked portfolio has declined by approximately -50%.
AlphaRank Top Stocks represents Accelerate’s predictive equity ranking powered by proven drivers of return. Stocks with the highest AlphaRank are expected to outperform, while stocks with the lowest AlphaRank are anticipated to underperform. AlphaRank assigns a numeric value to each security, ranging from 0 (bottom-ranked) to 100 (top-ranked), based on selected predictive factors. All Canadian and U.S. stocks priced above $1.50 per share and with a market capitalization exceeding $100 million are evaluated. In both the Accelerate Absolute Return Fund (TSX: HDGE) and the Accelerate Canadian Long Short Equity Fund (TSX: ATSX), Accelerate funds may be long many top-ranked stocks and short many bottom-ranked stocks. See AccelerateShares.com for more information.