

December 14, 2025 – Time Magazine’s Person of the Year is an annual designation that recognizes the person, group or idea that most influenced the world over the past year.
In 2025, AI emerged from its formative stages to become a truly life-changing technology deeply ingrained in our daily lives. As a result, it is justifiable that Time Magazine has selected “The Architects of AI” as its 2025 Person of the Year. The magazine cover featured tech luminaries from leading AI organizations including OpenAI, Anthropic, and Nvidia.

Beyond the symbolism, recognition of Time’s Person of the Year raises an important question for investors.
Historically, Time’s Person of the Year has signalled market sentiment extremes, serving as a useful contrarian indicator. There have been two notable examples of this magazine cover indicator that have served as a timely warning for investors:
- In 1999, Jeff Bezos was named Person of the Year at the height of the late 90’s technology bubble. The Nasdaq index peaked three months after the magazine’s release, and went on to decline by -78% over the following two years. Amazon stock dropped by more than -90% during the tech stock crash.
- In 2021, Elon Musk was on the Time magazine cover as its Person of the Year just as speculative technology stocks reached their cycle peak. The following year saw one of the worst tech drawdowns in two decades, with the Nasdaq index falling by -33% and Tesla dropping by -65% from peak to trough.
At inflection points for previous tech bubbles, Time’s Person of the Year served investors well as a contrarian market indicator. Will a subsequent tech bubble bursting make Time’s magazine indicator valid for the third time? Only time will tell. At the very least, this magazine indicator provides a useful barometer for investors, signalling that a theme has gone fully mainstream, and that equities related to the theme may be fully valued.
While the magazine cover indicator is an unconventional forecast tool for investors, a more traditional one is an interest rate prediction.
Last week, Federal Reserve officials voted to cut interest rates by 25bps at their latest FOMC meeting, lowering rates to a range of 3.50% to 3.75%. While the rate cut was well-telegraphed, with the market forecasting an approximate 90% chance of a rate cut at the meeting, notable data came from the accompanying “dot plot” interest rate forecast.
The most noteworthy news from the Fed was not that they cut interest rates by 25bps, it was that three FOMC participants pencilled in a rate hike for next year, while four forecast no more rate cuts in 2026, as shown in the FOMC’s dot plot.
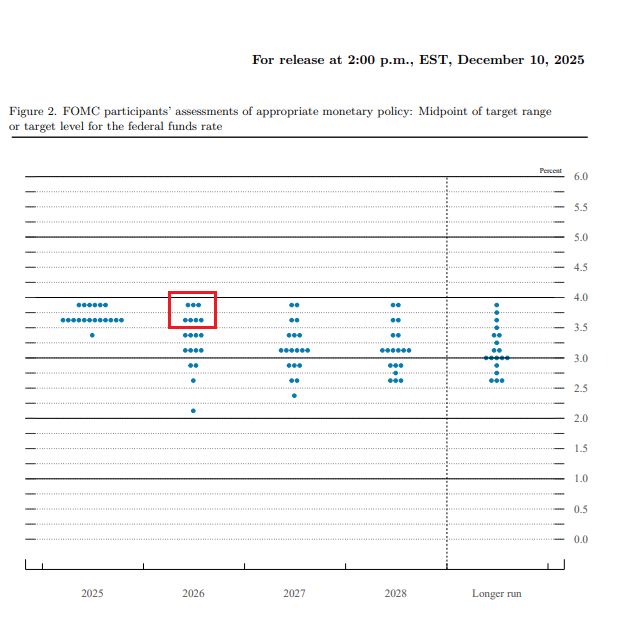
Furthermore, there are two important components contained in the above FOMC dot plot:
- There has been much consternation regarding political interference in central bank decisions. However, any potential political involvement is relatively easy to discern, given the Fed’s dual mandate of stable prices and full employment is guided by quantitative figures. For example, the current U.S. inflation rate is 3%, which is 100bps above the Fed’s target of 2% and has been consistently above that target for nearly five years. Moreover, the current U.S. unemployment rate of 4.4% is within the range that the Fed considers “full employment”. In addition, the influential Taylor Rule monetary policy calculation implies a fed funds rate above 4.0%. The logical conclusion is that interest rates should not be lowered further, given current economic data. Any way you cut it (pun intended), a further lowering of interest rates from here is political. Nevertheless, it is refreshing that seven FOMC members, as implied by the dot plot, are paying attention to the data, not politics.
- While the past eighteen months have given the market a reasonably smooth and predictable decline in interest rates, the outlook is murky. Currently, fed funds futures prices imply two more rate cuts this cycle. Ergo, we are at the tail-end of a rate-cutting cycle, and investors need to start preparing for the potential of rate hikes.
Market indicators, whether the traditional and straight-forward Fed dot plot forecast or the unconventional and unorthodox magazine cover indicator, can be useful tools for investors by providing context, gauging sentiment, and framing risk. Used properly, indicators do not directly predict markets, however, they may help investors make better decisions under uncertainty.
Accelerate manages five alternative investment solutions, each with a specific mandate:
- Accelerate Arbitrage Fund (TSX: ARB): Merger Arbitrage
- Accelerate Absolute Return Fund (TSX: HDGE): Absolute Return
- Accelerate OneChoice Alternative Multi-Asset Fund (TSX: ONEC): Multi-Asset
- Accelerate Canadian Long Short Equity Fund (TSX: ATSX): Long Short Equity
- Accelerate Diversified Credit Income Fund (TSX: INCM): Private Credit

ARB declined by -0.1% in November, as arbitrage spreads widened slightly.
Last month, nineteen public M&A deals were announced in North America, totalling more than $130 billion. While several deals made the Fund’s watchlist, none have yet made their way into the portfolio, given that the yields on these “investment grade” mergers have not yet met ARB’s hurdle rate. In contrast, there were ten SPAC IPOs in November, and the Fund participated in six of these deals.
Currently, ARB is 156.4% long and -10.0% short (166.4% gross), with 66% allocated to SPAC arbitrage and 34% to traditional merger arbitrage (including 17% to strategic M&A and 17% to leveraged buyouts).
We are pleased to announce that the Accelerate Arbitrage Fund (TSX: ARB) has once again been awarded a #1 global hedge fund performance ranking in the Merger Arbitrage category, as featured in the latest Barclay Managed Funds Report.
![]()

HDGE gained 4.6% in a month in which short selling added significant value.
Long-short factor performance was broadly positive in November, as undervalued and high-quality securities outperformed overvalued and low-quality stocks. Notably, the GS Most Shorted basket fell -6.9% for the month, while the GS U.S. Hedge Fund VIP basket dipped just -0.8%, leading to a +5.6% gain for the long short equity hedge fund proxy. Across the majority of factor portfolios, the long leg delivered positive returns while the short side (representing bottom-ranked securities) underperformed.
Top Fund contributors for the month include short positions in Aspen Aerogels and Cogent Communications, along with a long position in DPM Metals. Top Fund detractors include short positions in Huntsman, NeoGenomics, and Glaukos.
![]()
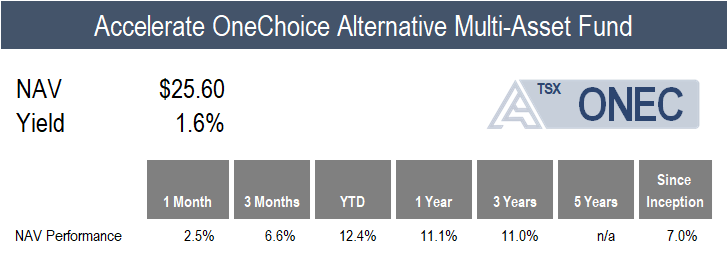
ONEC gained 2.5% over the month, with nearly all alternative asset classes contributing positively to Fund performance.
The Fund’s November return was primarily driven by its long short equity, absolute return, and gold allocations, which gained 8.4%, 4.6%, and 4.4%, respectively. In addition, ONEC’s infrastructure allocation added 3.1%, while managed futures gained 2.1% and commodities ticked up by 1.9%.
ONEC’s credit portfolio added 1.4% via its private credit allocation and 0.4% from its portfolio of broadly syndicated loans. Also providing a positive monthly return include the real estate portfolio, with a 1.1% increase, and risk parity, which returned 0.7%. Merger arbitrage was the Fund’s only decliner, falling -0.1%.
![]()
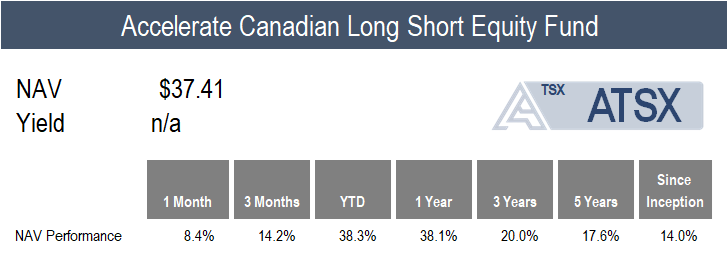
ATSX gained 8.4% in November compared to the benchmark S&P/TSX 60’s 3.6% increase.
Notably, all Canadian long short factor portfolios generated alpha last month. The long short operating momentum factor led with a 10.8% return, while the market neutral price momentum and value portfolios gained 6.5% and 4.3%, respectively. The long short quality and trend factors each generated returns of around 3.0%.
Top Fund contributors for the month include short positions in Ag Growth and Mattr, as well as a long position in DPM Metals. Top Fund detractors include short positions in Skeena Resources and Aya Gold & Silver, along with a long position in Stantec.
![]()
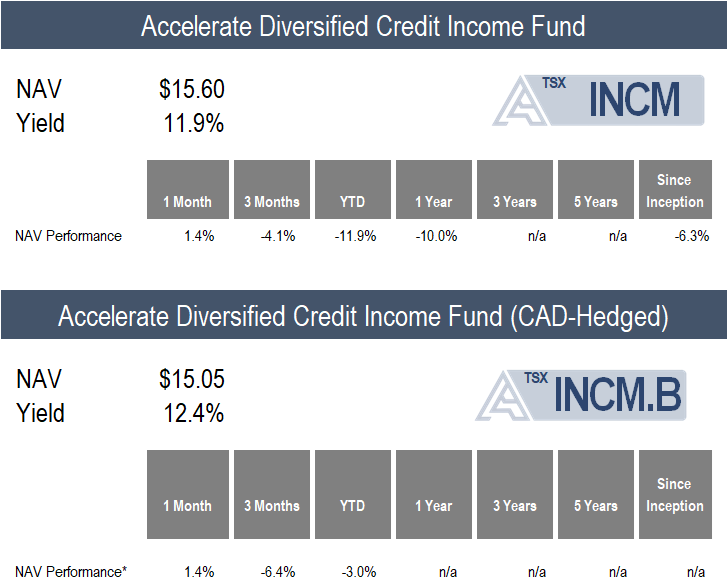
INCM generated a 1.4% return for the month, primarily generated by the portfolio’s yield, as NAV discounts remained significant and widespread.
The Fund’s private credit holdings, consisting of listed BDCs, offer two attractive characteristics for investors – liquidity and transparency. Given that BDCs are SEC-filers, every 90 days they file their quarterly financial statements showing not just the private credit fund particulars, but a line-by-line disclosure of every loan in their portfolio (including its terms, fair value marks, etc.). Correspondingly, all the Fund’s holdings have reported their third quarter results. From a fundamental perspective, the Q3 performance of the INCM portfolio was good, with an average 2.2% total return for the quarter (consisting of a 2.7% distribution and -0.5% NAV decline) across the Fund’s private credit holdings. In contrast, the Fund’s quarterly market performance was a different story, with a -7.1% total return decline, driven by a nearly -10% drop in secondary market prices as NAV discounts widened markedly. Long story short – there was a dramatic difference between the Fund’s positive underlying portfolio performance and the Fund’s market performance in the third quarter. As a result, the Fund’s private credit pools currently trade around 84 cents on the dollar on average.
Currently, INCM is allocated to 20 listed private credit funds, which hold more than 5,000 loans and investments. Of these loans, 87.8% are secured and 93.6% are floating rate, with a weighted average yield of 12.1%. INCM currently trades at a -15.5% discount to the underlying net asset value of its loan pools.
![]()
Have questions about Accelerate’s investment strategies? Click below to book a call with me:

-Julian
Disclaimer: This distribution does not constitute investment, legal or tax advice. Data provided in this distribution should not be viewed as a recommendation or solicitation of an offer to buy or sell any securities or investment strategies. Please read the relevant prospectus before investing. For a summary of the risks of an investment in the Accelerate ETFs, please see the specific risks set out in the prospectus. ETFs are not guaranteed and the information in this distribution is based on current market conditions and may fluctuate and change in the future. Past performance is not indicative of future results. Decisions regarding tax, investments, and all other financial matters should be made solely with the guidance of a qualified professional. Visit www.AccelerateShares.com for more information.

