
Accelerate Absolute Return Fund
Portfolio Protector.
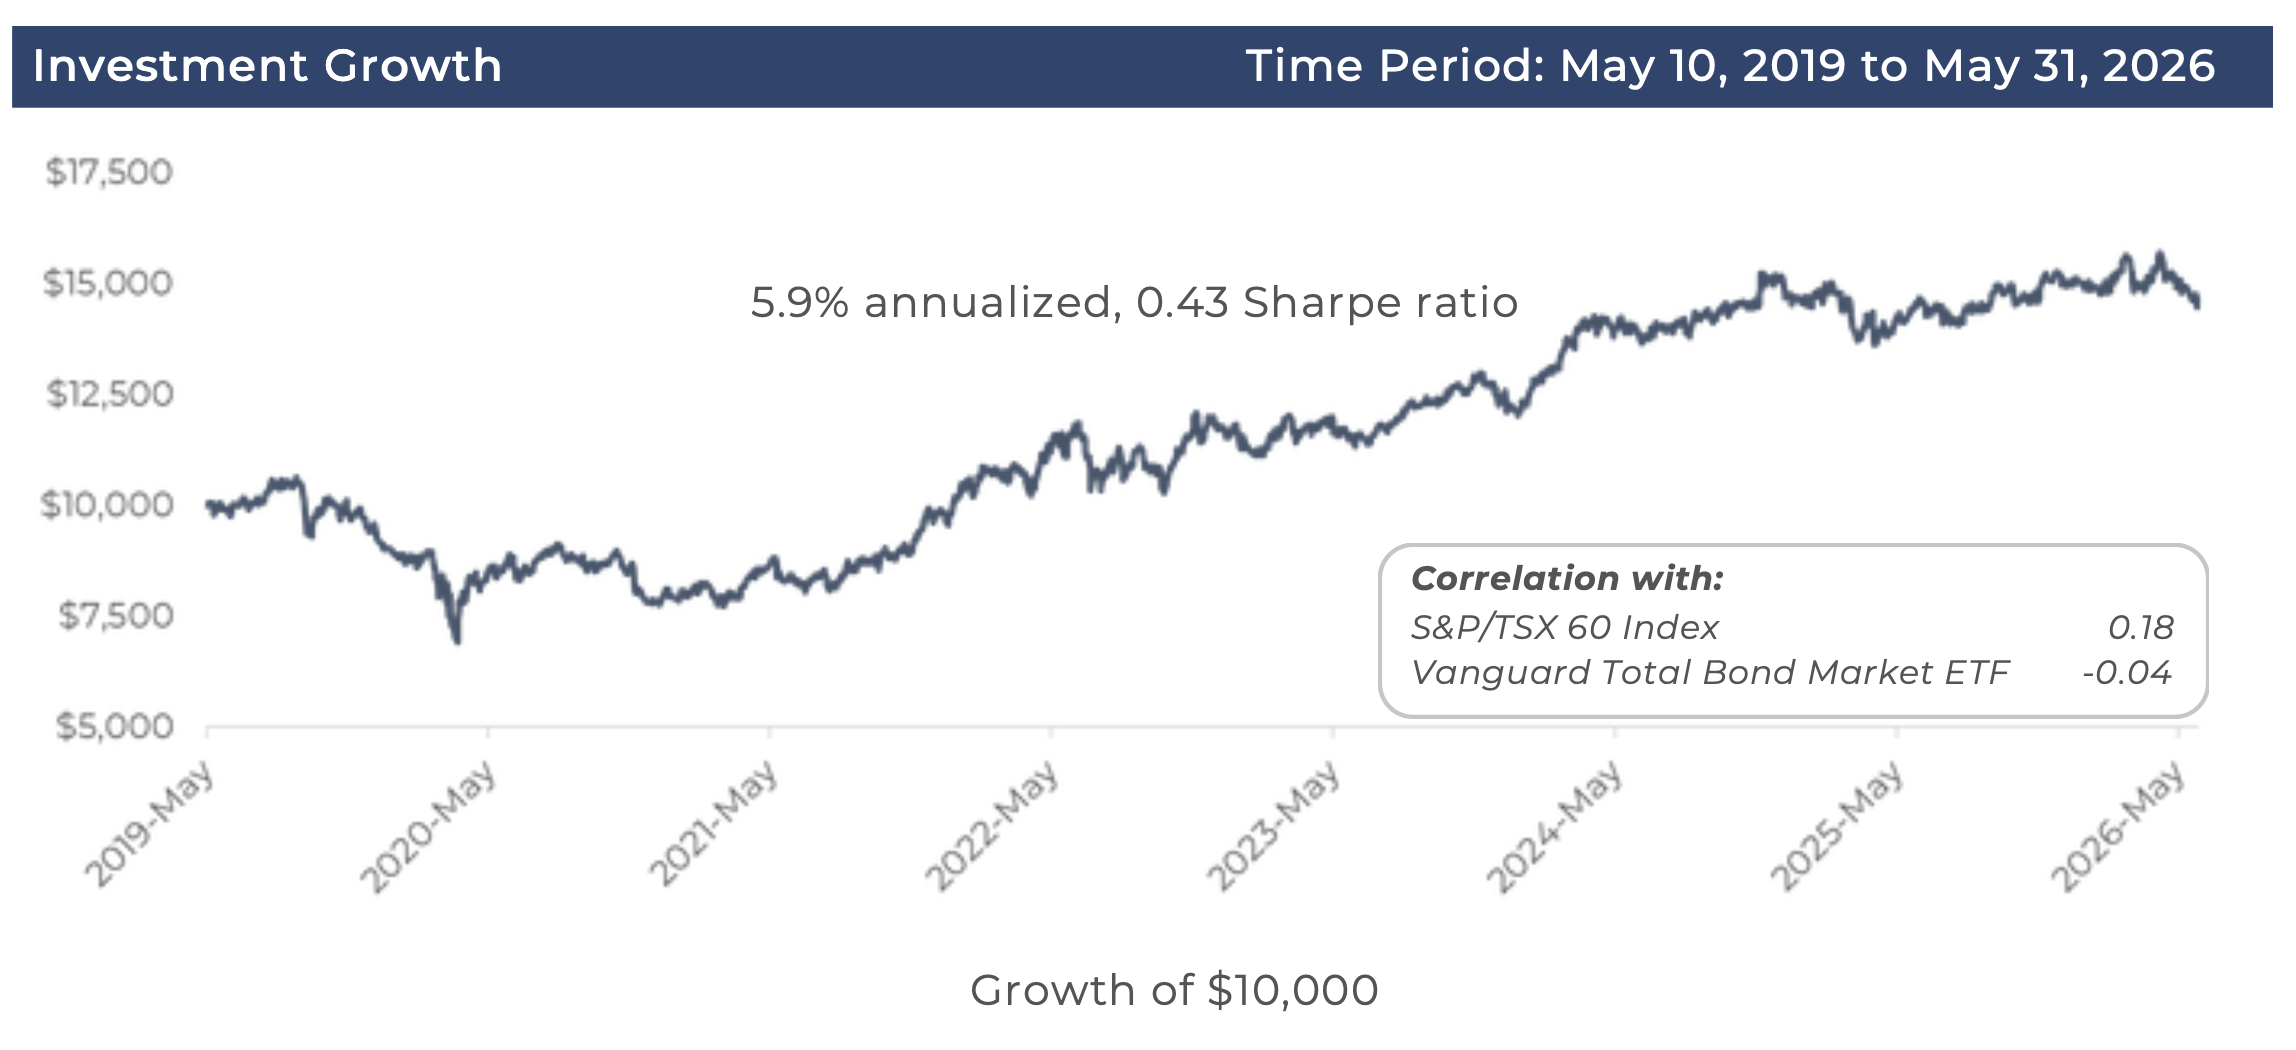
The Accelerate Absolute Return Fund (TSX:HDGE, HDGE.U) is a quantitative long-short equity hedge fund that seeks to achieve attractive risk-adjusted returns with low correlation to the broad equity markets.
About the Fund
The Accelerate Absolute Return Fund (TSX: HDGE, HDGE.U) is a quantitative long-short equity hedge fund that seeks to achieve attractive risk-adjusted returns with low correlation to the broad equity markets.
Investment Objectives
- Target 10-15% annualized returns
- Generate positive returns irrespective of market direction
- Hedge downside risk
- Manage volatility
- Provide uncorrelated returns
Accelerate Absolute Return Fund Explained:
HDGE TRADING DATA
NAV:
Date:
SUBSCRIBE TO OUR DISTRIBUTION LIST TO STAY UPDATED ON HDGE
QUICK FACTS
Type:
Long-short equity
Structure:
Alternative ETF
Date Started:
May 10, 2019
Management Fee:
0.00%
Performance Fee:
20% of outperformance over high water mark
Investment Manager:
Accelerate Financial Technologies Inc.
Distribution:
$0.10 per quarter
Exchange:
TSX
Currency:
CAD/USD
Risk Rating:
Medium
Track Record
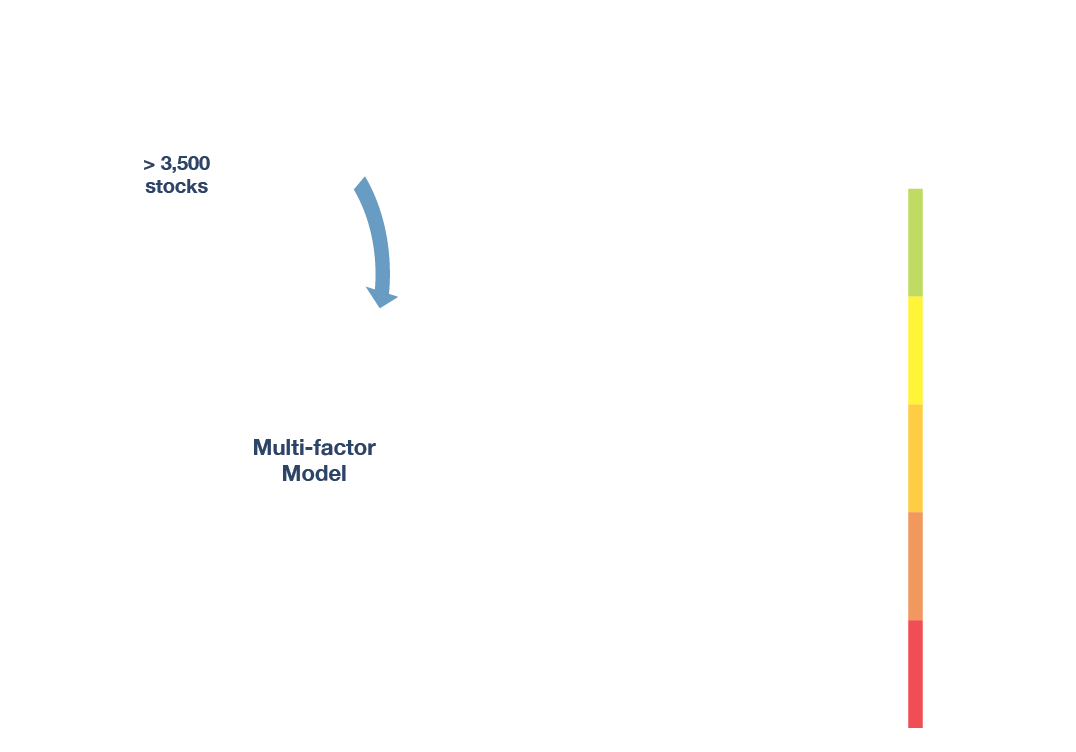
Investment Process
HDGE utilizes a systematic, proprietary multi-factor model to sort and rank all liquid North American stocks based on five principal factors:
- Value
- Quality
- Price Momentum
- Operating Momentum
- Trend
The Fund is long a portfolio of stocks chosen from those having the highest expected return according to our data-driven multi-factor model. At the same time, the Fund is short a portfolio of of stocks chosen from those having the lowest expected return. The portfolio is rebalanced on a monthly basis to achieve the highest expected risk-adjusted return for investors.
Performance as of 2026-May-31
| 1 Month | 3 Months | YTD | 1 Year | 3 Years | 5 Years | Since Inception | ||
|---|---|---|---|---|---|---|---|---|
| HDGE | -4.2% | -7.4% | -3.4% | -0.2% | 9.3% | 12.3% | 5.9% |
Fund Characteristics as of 2026-May-31
| Long | Short | |
|---|---|---|
| Number of Securities | 67 | 64 |
| Average Market Cap ($mm) | $126,263 | $14,860 |
| Median Market Cap ($mm) | $11,819 | $1,836 |
| Beta | 1.0 | 1.4 |
| EBITDA/EV | 9.3% | 0.6% |
| FCF/EV | 5.4% | -2.1% |
| Trailing Return | 98.6% | -18.1% |
| Pct of 52 Week High | 90.6% | 50.3% |
| Return on Capital | 26.8% | -7.5% |
| Gross Profits/Assets | 8.3% | 4.7% |
| 50 DMA to 200 DMA | 118.9% | 73.0% |
| EPS Revision | 1.3% | -0.6% |
| Change In Shares | -2.9% | 8.5% |
| Earnings Abnormal Return | -0.1% | -2.6% |
Sector Weightings as of 2026-May-31
| Long | Short | |
|---|---|---|
| 0.0% | Long | Short |
| Communication Services | 6.6% | -2.9% |
| Consumer Discretionary | 16.4% | -6.5% |
| Consumer Staples | 6.6% | -1.4% |
| Energy | 14.8% | 0.0% |
| Financials | 14.8% | -6.5% |
| Health Care | 9.8% | -2.9% |
| Industrials | 11.5% | -7.9% |
| Information Technology | 16.4% | -10.1% |
| Materials | 11.5% | -6.5% |
| Real Estate | 1.6% | -1.4% |
| Utilities | 0.0% | 0.0% |
Top Holdings as of 2026-May-31
| Long Security Name | Weight | |
|---|---|---|
| Dell Technologies Inc | 2.2% | |
| Quebecor Inc | 2.0% | |
| Micron Technology Inc | 2.0% | |
| Garrett Motion Inc | 1.9% | |
| Cardinal Health Inc | 1.9% | |
| Tapestry Inc | 1.9% | |
| Five Below Inc | 1.8% | |
| Globus Medical Inc | 1.8% | |
| Lam Research Corp | 1.8% | |
| Finning International Inc | 1.8% | |
| Tactile Systems Technology Inc | 1.8% | |
| Apple Inc | 1.8% | |
| Aritzia Inc | 1.8% | |
| Seagate Technology Holdings PL | 1.8% | |
| Ross Stores Inc | 1.8% | |
| Linamar Corp | 1.8% | |
| Signet Jewelers Ltd | 1.8% | |
| Royal Bank of Canada | 1.8% | |
| Teradyne Inc | 1.8% | |
| McKesson Corp | 1.8% | |
| TD SYNNEX Corp | 1.8% | |
| Loblaw Cos Ltd | 1.8% | |
| Monarch Casino & Resort Inc | 1.8% | |
| Western Digital Corp | 1.8% | |
| Expedia Group Inc | 1.7% | |
| George Weston Ltd | 1.7% | |
| Popular Inc | 1.7% | |
| WSFS Financial Corp | 1.7% | |
| Match Group Inc | 1.7% | |
| Weatherford International PLC | 1.7% | |
| Alphabet Inc | 1.7% | |
| Cathay General Bancorp | 1.7% | |
| Cirrus Logic Inc | 1.7% | |
| Andersons Inc/The | 1.7% | |
| Rockwell Automation Inc | 1.7% | |
| Jabil Inc | 1.7% | |
| APA Corp | 1.7% | |
| Federated Hermes Inc | 1.7% | |
| Matson Inc | 1.7% | |
| Travelers Cos Inc/The | 1.7% | |
| Valero Energy Corp | 1.7% | |
| Magnolia Oil & Gas Corp | 1.7% | |
| Hanover Insurance Group Inc/Th | 1.7% | |
| Pathward Financial Inc | 1.7% | |
| Hamilton Insurance Group Ltd | 1.7% | |
| New York Times Co/The | 1.7% | |
| TechnipFMC PLC | 1.6% | |
| Delek US Holdings Inc | 1.6% | |
| Devon Energy Corp | 1.6% | |
| AZZ Inc | 1.6% | |
| CF Industries Holdings Inc | 1.6% | |
| Herbalife Nutrition Ltd | 1.6% | |
| Kinross Gold Corp | 1.6% | |
| Tidewater Inc | 1.6% | |
| Centerra Gold Inc | 1.5% | |
| EMCOR Group Inc | 1.5% | |
| Tenet Healthcare Corp | 1.5% | |
| HCA Healthcare Inc | 1.5% | |
| Comfort Systems USA Inc | 1.5% | |
| OceanaGold Corp | 1.5% | |
| Newmont Corp | 1.5% | |
| Wesdome Gold Mines Ltd | 1.5% | |
| Jones Lang LaSalle Inc | 1.5% | |
| Endeavour Mining PLC | 1.5% | |
| Murphy USA Inc | 1.5% | |
| International Seaways Inc | 1.5% | |
| Atmus Filtration Technologies | 1.4% |


DISCLAIMER: This information on this web page does not constitute investment, legal or tax advice. Performance is inclusive of reinvested distributions. Past performance is not indicative of future results. Any data provided on this web page should not be viewed as a recommendation or solicitation of an offer to buy or sell any securities or investment strategies. The information on this web page is based on market conditions and may fluctuate and change without notice. Accelerate does not accept any liability for any direct, indirect or consequential loss or damage suffered by any person as a result of relying on all or any part of this website and any liability is expressly disclaimed.

